(T2108 measures the percentage of stocks trading above their respective 40-day moving averages [DMAs]. It helps to identify extremes in market sentiment that are highly likely to reverse. To learn more about it, see my T2108 Resource Page. You can follow real-time T2108 commentary on twitter using the #T2108 hashtag. T2108-related trades and other trades are posted on twitter using the #120trade hashtag)
T2108 Status: 69.0% (ending 31 days of overbought conditions)
VIX Status: 12.5
General (Short-term) Trading Call: See below.
Reference Charts (click for view of last 6 months from Stockcharts.com):
S&P 500 or SPY
SDS (ProShares UltraShort S&P500)
U.S. Dollar Index (volatility index)
VIX (volatility index)
VXX (iPath S&P 500 VIX Short-Term Futures ETN)
EWG (iShares MSCI Germany Index Fund)
CAT (Caterpillar)
Commentary
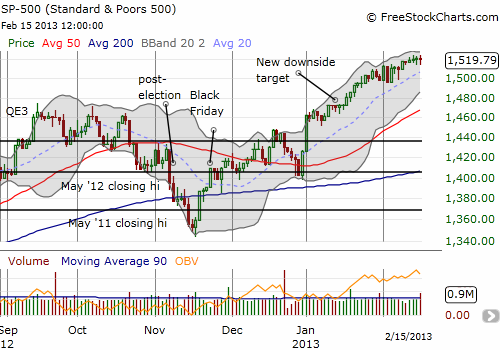
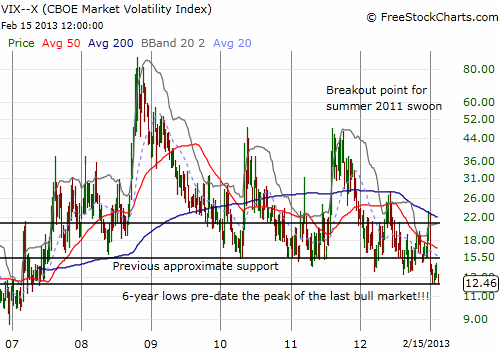
2012 began with a bang and generated a stubborn overbought period that lasted for an historic 43 days, the seventh longest on record since at least 1986. That overbought period ended in an anti-climactic fashion with no sell-off or steep plunge. The maximum and net returns were 7.6% and 6.8%, respectively. This year’s start with an extreme overbought period was not quite as historic, lasting 31 days, but it too ended in anti-climactic fashion. The S&P 500 sits essentially at 5+ year highs, the VIX has managed to trade back DOWN to SIX year lows, and on-balance volume (OBV) is at levels last seen in mid-March of 2012. The maximum and net returns for this last overbought period are essentially the same at 6.7% and 6.6% respectively.


What followed the end of last year’s overbought rally unfolded relatively close to the script I laid out at the time based on historical analysis:
- The maximum sell-off from here should be around 7-8%.
- It is just as likely that the sell-off will be no more than 2%.
- At least one more rally should follow whatever correction occurs. HOWEVER, the risks of a much larger sell-off will increase in the next overbought periods.
A sell-off followed the very next day. The S&P 500 dropped 1.5%. The index rallied sharply from there, hitting overbought levels again in a week. This overbought period last a mere one day. As the index continued to trickle upward, I marveled at the persistence of the bearish divergence. It took almost another three weeks for the bearish divergence to get resolved to the downside. The S&P 500 sold off sharply to begin the month of April, sending the index below the endpoint of the 43-day overbought period. A relief rally preceded the May swoon that nearly wiped out all of 2012’s hard fought gains before it ended. I have every reason to believe 2013 will continue to resemble 2012, especially given the market has a catalyst in the form of serious budget wrangling in D.C.
My last batch of SSO puts expired last Friday, and I plan to round up a fresh batch this coming week. However, the overall strategy of buy the dip and sell quick will still apply until the market tags its next overbought period. At THAT point, I will switch to a more sustained bearish stance. This strategy assumes that everything unfolds according to historical patterns.
The S&P 500 chart above includes an adjusted presumed downside target for whenever the next correction occurs. I moved it to coincide roughly with where the 50DMA will likely sit around the time of a sell-off. This point conveniently matches the previous 52-week high that was marked by the triple-top printed from September to October.
Daily T2108 vs the S&P 500

Black line: T2108 (measured on the right); Green line: S&P 500 (for comparative purposes)
Red line: T2108 Overbought (70%); Blue line: T2108 Oversold (20%)
Weekly T2108

*All charts created using freestockcharts.com unless otherwise stated
Related links:
The T2108 Resource Page
Expanded daily chart of T2108 versus the S&P 500
Expanded weekly chart of T2108
Be careful out there!
Full disclosure: long VXX shares and puts
