(T2108 measures the percentage of stocks trading above their respective 40-day moving averages [DMAs]. It helps to identify extremes in market sentiment that are highly likely to reverse. To learn more about it, see my T2108 Resource Page. You can follow real-time T2108 commentary on twitter using the #T2108 hashtag. T2108-related trades and other trades are posted on twitter using the #120trade hashtag)
T2108 Status: 19.1% (oversold day #1)
VIX Status: 17.9
General (Short-term) Trading Call: Start closing out shorts; if aggressive, start buying; if conservative, try to wait for higher VIX, a large spike into mid-20s would be ideal (but note that if VIX does not spike, conservative traders will likely miss the best entry points)
Reference Charts (click for view of last 6 months from Stockcharts.com):
S&P 500 or SPY
SDS (ProShares UltraShort S&P500)
U.S. Dollar Index (volatility index)
VIX (volatility index)
VXX (iPath S&P 500 VIX Short-Term Futures ETN)
EWG (iShares MSCI Germany Index Fund)
CAT (Caterpillar)
Commentary
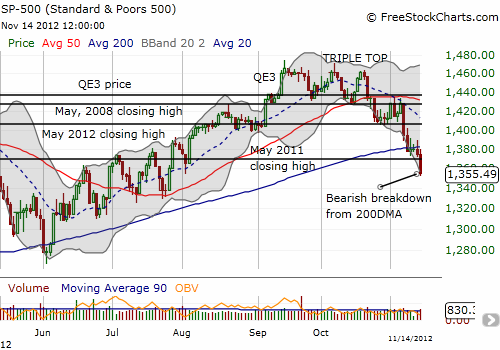
T2108 dropped into oversold territory for the first time since the June lows. While this drop is “on schedule” it did not unfold as expected or desired. The S&P 500 (SPY) has not only broken down below its 200DMA, but also it has broken below moderate support at the May, 2011 closing high.

Last week, I noted several reasons for optimistically thinking that the S&P 500 would create a false breakdown below the 200DMA just as it entered oversold territory. The November call options on SSO I bought as a part of that expectation will surely expire worthless. I will still be holding December call options and SSO shares. The shares I bought in case the rebound from oversold becomes a long, drawn out process. It seems a long and drawn out process lays ahead. the broken support at the 200DMA will surely become stiff resistance when it next gets tested from below.
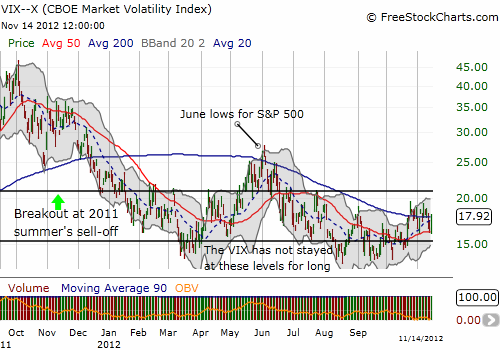
The strangest component of the S&P 500’s latest woes is that volatility has not responded. The VIX remains well below levels seen at the June lows. In fact, the VIX is not even higher than it was last week. The market is showing little concern for the current breakdown, meaning that there remains plenty of room for fear to build to higher levels. This increase in fear should take the S&P 500 ever lower. Aggressive traders who buy the oversold signal now need to prepare for continued selling. The S&P 500 has given up half of its gains from the bounce from June lows, and there is no more “natural” support until those same lows. The mini-lows on the way up from the June lows did not create firm bases. For reference see how quickly the May swoon unfolded with barely a pause.
Conservative traders may wait for a retest of the June lows or, even better, a spike in volatility that at least takes the VIX into the mid-20s. Such a move would retest the VIX’s levels from the June lows and is well above last year’s big bearish breakout.

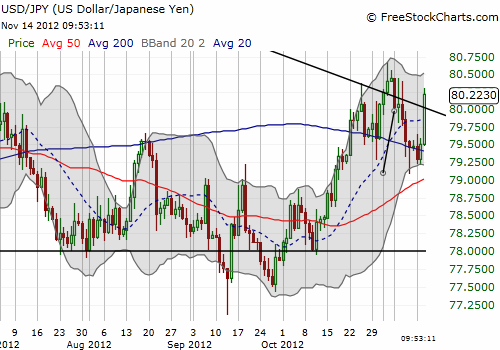
On a similar vein, the Japanese yen, typically a safe haven at times like these has been weakening in general. Up until today, the Australian dollar had remained very resilient against the U.S. dollar. The Australian dollar is supposed to be a proxy for investor’s desire to take on risk. The Australian dollar has even been rallying strongly against the euro and the pound. This strength is in “defiance” of the RBA’s clear desire to push the currency back down. So, the currency markets may be just as blase as the equity markets. It is of course also possible that some fundamental changes in the forex markets are playing out. I continue to watch these developments very closely!


Daily T2108 vs the S&P 500

Black line: T2108 (measured on the right); Green line: S&P 500 (for comparative purposes)
Weekly T2108

*All charts created using freestockcharts.com unless otherwise stated
Related links:
The T2108 Resource Page
Expanded daily chart of T2108 versus the S&P 500
Expanded weekly chart of T2108
Be careful out there!
Full disclosure: long SSO calls and shares, long VXX shares and puts, net short Australian dollar, long Japanese yen (through AUD/JPY), short GBP/USD
