(T2108 measures the percentage of stocks trading above their respective 40-day moving averages [DMAs]. To learn more about it, see my T2108 Resource Page. You can follow real-time T2108 commentary on twitter using the #T2108 hashtag. T2108-related trades and other trades are posted on twitter using the #120trade hashtag)
T2108 Status: 70.3% (first day day of FIFTH overbought period since June 29)
VIX Status: 14.6
General (Short-term) Trading Call: Hold. See below for more details.
Reference Charts (click for view of last 6 months from Stockcharts.com):
S&P 500 or SPY
SDS (ProShares UltraShort S&P500)
U.S. Dollar Index (volatility index)
VIX (volatility index)
VXX (iPath S&P 500 VIX Short-Term Futures ETN)
EWG (iShares MSCI Germany Index Fund)
CAT (Caterpillar)
Commentary
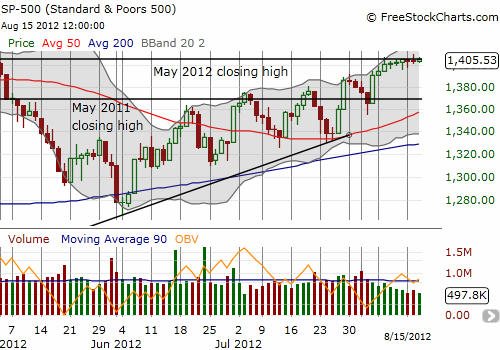
I barely had time to catch my breath after yesterday’s marginal slide from overbought territory only to find T2108 right back in overbought conditions. I found yesterday’s fade from the highs and breakout territory quite ironic after having just observed that sellers had yet to hold the S&P 500 at intraday lows throughout the overbought period. (T2108 dropped from 70.5% to 69.3% – a very marginal end to the last overbought period). In fact, with a close neatly tucked under the line of resistance formed by the April high, the S&P 500 looked like it had printed a classic fake breakout. Today’s action leaves that signal in doubt.

T2108 is starting its fifth overbought period since the end of June. The fourth overbought period ended quite differently than the previous three. It did not generate a sharp (and profitable) sell-off. In fact, the S&P 500 ended the last overbought period with a slight GAIN. By immediately reverting to overbought status, the market reconfirms its upward bias and upward pressure. The onus remains on the sellers to prove otherwise. The path of least resistance is up.
While we await resolution of this steady drip upward, smart trades are hard to come by. I expect my current crop of SSO puts to go to waste. It is also not quite time to convert my SDS shares into HDGE shares (awaiting breakout to fresh multi-year highs). I do not recommend accumulating a larger bearish position. Since yesterday’s end of the previous overbought period was so marginal, I am treating the start of the current overbought period as if it is just a continuation of the last one. Definitely initiate a fresh bearish position if you do not have one yet, especially if you continue to ride substantial long positions.
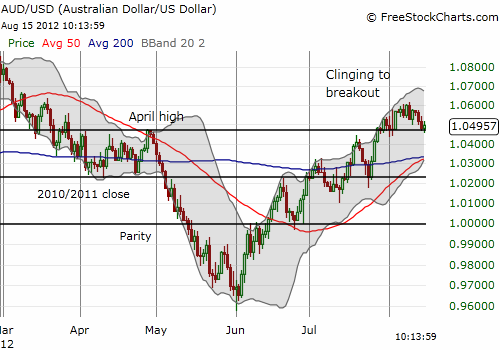
I end with a look at the Australian dollar versus the US dollar (FXA). AUD/USD continues to provide excellent trading signals on the S&P 500. At the time of writing, AUD/USD is right at the edge of resistance turned support from the April, 2012 high. A break here will likely take AUD/USD to the converging 50 and 200DMAs. That will undoubtedly accompany a (small?) sell-off on S&P 500. A bounce to new highs should of course accompany renewed upward momentum on the S&P 500 – to multi-year highs even. Stay tuned!

Daily T2108 vs the S&P 500
Click chart for extended view with S&P 500 fully scaled vertically (updated at least once a week)

Black line: T2108 (measured on the right); Green line: S&P 500 (for comparative purposes)
Weekly T2108

*All charts created using freestockcharts.com unless otherwise stated
Related links:
The T2108 Resource Page
Expanded daily chart of T2108 versus the S&P 500
Expanded weekly chart of T2108
Be careful out there!
Full disclosure: long SDS; long SSO puts; long VXX shares, calls, and puts; short VXX calls; short AUD/USD
