(T2108 measures the percentage of stocks trading above their respective 40-day moving averages [DMAs]. To learn more about it, see my T2108 Resource Page. You can follow real-time T2108 commentary on twitter using the #T2108 hashtag. T2108-related trades and other trades are posted on twitter using the #120trade hashtag)
T2108 Status: 71.2% (First overbought day)
VIX Status: 17.1
General (Short-term) Trading Call: Start selling bullish trades, open fresh bearish trades
Reference Charts (click for view of last 6 months from Stockcharts.com):
S&P 500 or SPY
SDS (ProShares UltraShort S&P500)
U.S. Dollar Index (volatility index)
VIX (volatility index)
VXX (iPath S&P 500 VIX Short-Term Futures ETN)
EWG (iShares MSCI Germany Index Fund)
CAT (Caterpillar)
Commentary
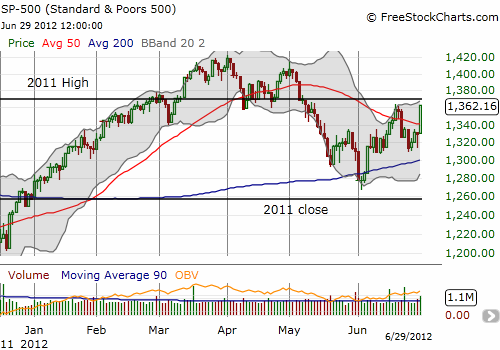
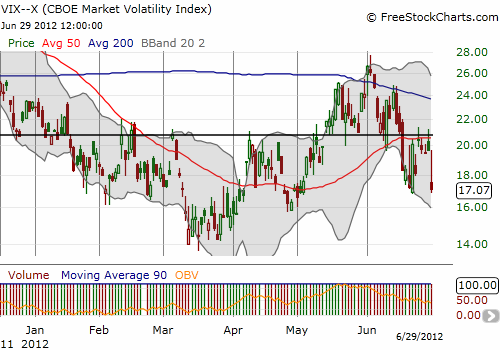
My last T2108 Update was for Monday’s trading where the S&P 500 lost 1.6% and T2108 plunged to 33.4%. Although it looked like this follow-through selling would likely send the S&P 500 to a retest of 200DMA support (and oversold conditions), the VIX could not reclaim the critical 21 level. On Thursday, the S&P 500 sold off toward the week’s low only to rally strongly into the close. Once again, the VIX failed to hold the 21 level. And in an incredible flash, T2108 closed Friday at an overbought reading of 71%. I had to blink several times to make sure I could believe what I saw. T2108’s surge from 47% occurred on the heels of a monster 2.5% rally in the S&P 500. This was the best June for the S&P 500 since 1999 – a nice mirror image of last month which was one of the worst Mays for the S&P 500 since 1950!
The charts below show the action in the S&P 500 and the VIX. Note how the S&P 500 rallied to a closing high for the month that is still below the intraday high; overhead resistance remains at the 2011 high.


The plunge in the VIX caused VXX, the iPath S&P 500 VIX ST Futures ETN, to collapse to new all-time lows. I expected volatility to drop after the European summit (without predicting its outcome), and I was able to continue my strategy of playing VXX puts against shares by selling the latest round of puts at a large profit. (I also sold another round of SSO shares). This is what I tweeted on Wednesday, June 27 as part of my regular T2108 postings:
“%stocks > 40DMA soared to 45%. #VIX barely budged though. Should get smashed after Euro summit? $SPY still btwn 50 & 200DMAs. #T2108”
This is another interesting and critical juncture for the market. Technically, this is a great point to open up fresh bearish positions on the assumption that overbought conditions will cause the S&P 500 to fail at resistance. However, this breakout was exactly what I wanted to see to refresh my bullishness and overcome my wariness brought on by observed correlations with the Japanese yen. Moreover, as I have discussed repeatedly, history suggests that the extended, extreme overbought period that started 2012 should be a prelude to at least one more strong rally. On top of that, the history of summer trading includes multiple bursts that take the S&P 500 back to highs from May although summer’s risk is that when the rallies do not happen, the sell-offs tend to be extremely vicious (like the last two summers). I believe June’s strong showing removes a major summer sell-off from the table of likely scenarios.
So what now? The T2108 trading rules do not allow me to get more bullish at overbought levels. Instead, I am looking for the opportunity to continue to buy the dips going forward. I will keep my upside expectations very modest, and, as a result, will only hold bullish positions for very short periods – at least until the S&P 500 manages to break to a new high for the year. I will NOT get aggressive with any bearish plays.
For those of you trying to think fundamentally and still believe that Europe is going to cause the next market Armageddon, I ask that you at least consider how the S&P 500 is telling us something completely different. The annual consternation brought on by Europe’s crisis has taken the S&P 500 to lows that do not break the previous year’s lows. The subsequent rallies have taken the index to higher highs. In other words, the market is telling us that it believes a sustainable solution is in progress, and/or whatever is to come is not going to have a major impact on the U.S. market. This is a bullish sign that must be heeded – at least until some NEW bearish catalyst comes along (like a break of the higher lows or a failure to print a higher high).

Black line: T2108 (measured on the right); Green line: S&P 500 (for comparative purposes)
Weekly T2108

*All charts created using freestockcharts.com unless otherwise stated
Related links:
The T2108 Resource Page
Expanded daily chart of T2108 versus the S&P 500
Expanded weekly chart of T2108
Be careful out there!
Full disclosure: long SDS; long VXX calls and shares; net short Japanese yen


Still not sure why you aren’t showing a good S&P line vs. your T2108? Just let me know what problems you are having! It should look like this:
https://www.dropbox.com/s/25lenv4m46n9jas/T2108-062912.png
Admittedly, it is a bit of laziness as I have yet to get the free TC2000 software for doing this! 🙂
OK. I am good now. I see I can run TC2000 in demo mode. Doing this though adds slightly more work to creating the chart. I will try to use it at least once a week or so.