(T2108 measures the percentage of stocks trading above their respective 40-day moving averages [DMAs]. To learn more about it, see my T2108 Resource Page. You can follow real-time T2108 commentary on twitter using the #T2108 hashtag. T2108-related trades and other trades are posted on twitter using the #120trade hashtag)
T2108 Status: 39%
VIX Status: 17.4%
General (Short-term) Trading Call: Hold. (click here for a trading summary posted on twitter)
Reference Charts (click for view of last 6 months from Stockcharts.com):
S&P 500 or SPY
SDS (ProShares UltraShort S&P500)
U.S. Dollar Index (volatility index)
VIX (volatility index)
VXX (iPath S&P 500 VIX Short-Term Futures ETN)
EWG (iShares MSCI Germany Index Fund)
CAT (Caterpillar)
Commentary
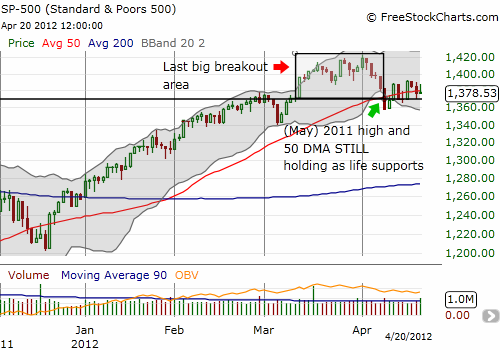
I picked a perfect week to put the T2108 Update on a brief hiatus. While T2108 moved up from 31% to the current 39%, the S&P 500 essentially ended the week flat. Tuesday’s big rally was erased at the lows on Thursday. It was a churn-filled week that remarkably took place just above the lingering support provided by the May, 2011 highs (again, you can’t make this stuff up!). The 50DMA has also joined the forces in an attempt to firm up support. This sets up a potentially tension-filled week as bulls cling to support, unable to generate fresh upward momentum, and bears hope, unable to deliver a decisive plunge through support.

The volatility index, the VIX, did end the week lower. The 50DMA has provided reliable support during this time. This has caused VXX to cool off after a vigorous rally off the March lows. Finally, the CAT-watch is at a “yellow flag” status as the stock continues to hover below the 50DMA. Bears should be eager to short here while bulls must hope that CAT can break through resistance. I highly doubt the general market will leave CAT behind, so I will be watching CAT even more closely in the coming week.
Options expiration sent out two batches of SSO calls and one batch of VXX puts worthless. This was the first major setback in the T2108 trades since I changed my strategy in mid-March. Going forward I am toning down the aggressiveness of the bullish plays. The market is in a kind of limbo and it does not make sense to go after any direction until I get a signal to do otherwise. I am also keenly aware of the danger in a market that appears to lose momentum after a strong rally. The market needs a new catalyst, and I am not sure what that will be.
In the meantime, the foreign exchange markets (forex) keep sending me warning signs that are further dampening my enthusiasm for aggressively bullish plays. The Japanese yen is getting stronger than I would like, and an extreme in correlation between USD/JPY (U.S. dollar to Japanese yen ratio) is flagging one warning (for more detail see “Bearish Implications Of A Rare Convergence Of Extremes In Yen Vs. S&P 500 Correlations“). Moreover, the Australian dollar’s weakness combined with a change in relative performance with the S&P 500 is flagging another warning signal (for more see “Positioning More Bearishly Vs. The Australian Dollar As It Loses 2012′s Gains“). The currency market is keeping me on my toes, and I need to reserve a full post dedicated to my current thoughts and positioning. So note that my disclosure below does not represent a complete story…
Black line: T2108 (measured on the right); Green line: S&P 500 (for comparative purposes)
Weekly T2108

*All charts created using freestockcharts.com unless otherwise stated
Related links:
The T2108 Resource Page
Expanded daily chart of T2108 versus the S&P 500
Expanded weekly chart of T2108
Be careful out there!
Full disclosure: long SDS; long VXX puts; long CAT shares and puts; net long Australian dollar; roughly neutral Japanese yen

