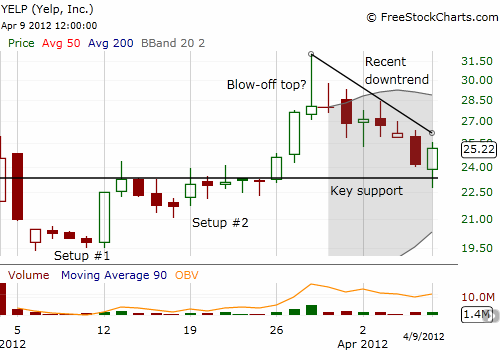
Yelp.com (YELP) is barely a month old as a publicly traded company, but it is already printing a fascinating stock chart.
YELP’s IPO was priced at $15, but it opened for trading on March 2nd, 2012 at $22. That day, the stock went as high as $26 before settling at $24.58. After dropping 15% the next day, YELP seemed quickly destined for $15 and lower. Instead, the stock stabilized and eventually soared as high as $31.96 before selling off again. That surge has all the markers of a blow-off top and today’s test of key support marks a complete reversal of gains from YELP’s last breakout.

Source: FreeStockCharts.com
Let’s step through the patterns…
Setup #1 was an important stabilization of YELP that forged a bottom. Selling interest slowly and surely dried up and set up the strong bounce from the bottom on March 12th, a 14% gain.
This new buying interest hit a wall on the second day and gave way to another eight days of consolidation where that $23.40 level held firm as resistance. I call this phase setup #2. The picture-perfect surge from this setup produced three days of furious buying. The first day produced a 6% gain and a close exactly at YELP’s post-IPO closing high set on the first day of trading (you simply cannot make this stuff up!). The second day of the surge produced a 12% gain. YELP closed at all-time highs on all-time high buying volume. Volume reached its highest point ever. The third and final day of the surge only produced a 1.6% gain but only after YELP traded as high as 16%. Volume surged again, but this time it helped take the stock down as profit-taking overwhelmed the stock. Such a massive reversal is important because at all-time highs, almost every person owning YELP shares had profit to take. With these profits taken, the stock becomes broken until it can produce fresh all-time highs.
YELP has yet to even match its close on March 28th. It has traded with a downward bias ever since. Today’s 4% gain was the first real sign of life throughout this downtrend. Buying interest appeared as YELP broke the key support line that served as resistance during setup #2.
From peak to break of critical support, YELP lost 28% in seven trading days. This steep and rapid drop in price following a rapid increase in price meets the definition of a blow-off top. Anyone buying during that day and still holding stock will be an eager seller on any future rallies in the stock. This motivation forms significant resistance to the stock. Even though the stock may still have small run-ups, they will occur from lower and lower price points. If YELP somehow manages to print fresh all-time highs despite the significant resistance from the blow-off top, it could signify a new bullish run. But let’s take this one step at a time…
I am guessing that support will not last much longer, especially if the general market continues to weaken. At best, YELP may try another run-up to rechallenge the close from March 28th before turning downward again to break support and retest the $15 IPO price.
Be careful out there!
Full disclosure: no positions
