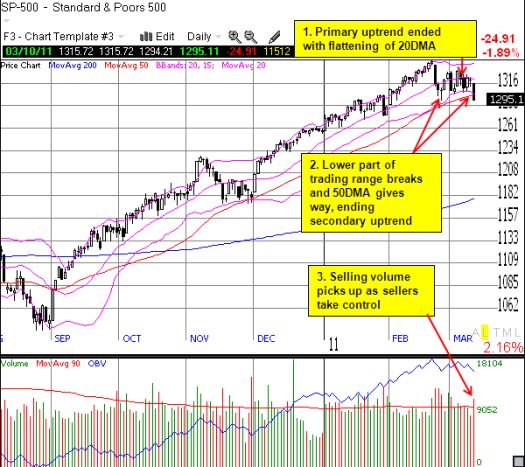
The primary upward trend in the S&P 500 finally ended, and the advantage in trading finally goes to the sellers for the first time since August, 2010. For me, technically, the upward trend ended with the flattening of the 20DMA. I noted this important change yesterday. The confirmation of the end came today with the S&P 500 breaking down below both the recent trading range and the 50-day moving average (DMA).

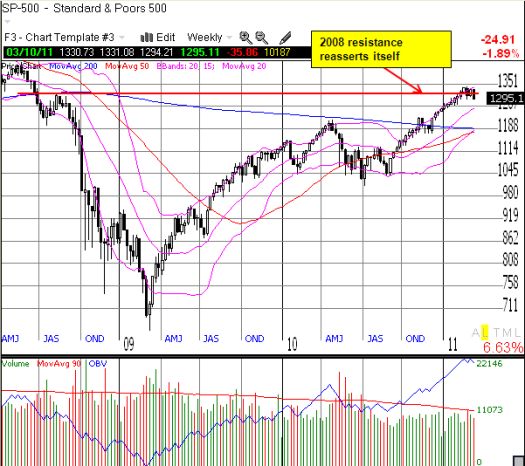
It is far to early to speculate on a retest of the 200DMA. After all, it was just about 3 weeks ago, right before the current sell-off, that I was calculating how the S&P 500 could retest 52-week highs by year-end at the current pace. However, the weekly chart is a good visual reminder of the momentum that brought the market to its current levels. It also shows how the action in the past month now represents a false breakout above the 1300-1310 resistance that I had assumed would cap the market for the entire year.

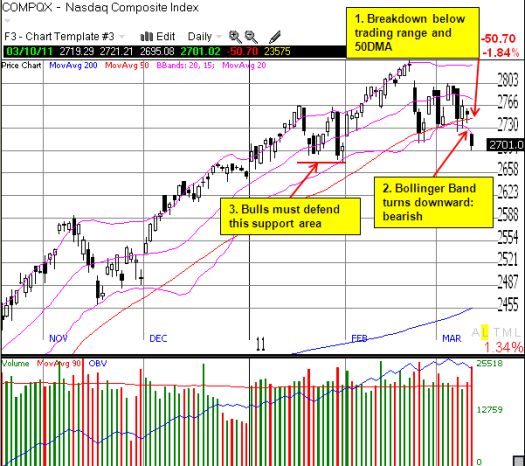
The NASDAQ seemed destined to retest its 2007 multi-year high of 2859 within weeks. So its breakdown is more dramatic than the S&P 500’s breakdown. The NASDAQ closed right at critical support for 2011, but the lower-Bollinger Band has “opened up” and pointing the way to continued selling.

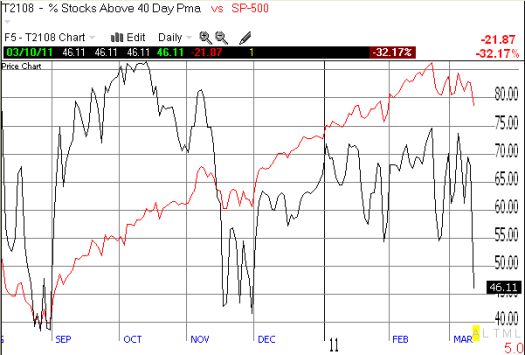
The dramatic nature of Thursday’s breakdown is visualized best with T2108, the percentage of stocks trading above their 40DMAs. The following quote is my commentary from the T2108 resource page:
“This was a BIG day. T2108 plunged 22 percentage points, or 32%, to close at 46%. The last time T2108 lost this many percentage points was October 28, 2009. The indicator bounced back the next day and never quite reached official oversold levels. The last time T2108 lost this much on a percentage basis was June 29, 2010 when it dropped 36%. T2108 sailed past the previous lows of 2011 to levels not seen since the end of November when the market last “wobbled” as it is doing now.”

*All charts created using TeleChart:

All these indicators push advantage to the bears. The burden on the bulls in the short-term is to hold critical support levels. Only a break above the recent trading range will restore advantage to the bulls. Until then, I am biased to focus on shorting opportunities, especially fading rallies and up gaps (special exemptions go for my favorite long plays like commodity-related stocks and solar stocks – for example, I just restarted a position in GT Solar {SOLR} now that it is 20% below my fair value target). I sold my SSO puts in anticipation of a bounce from current support levels, especially because, in a sense, T2108 is itself oversold given the numbers I quoted above.
However, there is yet no reason for bears to anticipate the end of the bull market as we know it. For example, T2107, the percentage of stocks trading above their 200DMAs remains a lofty 77%. While this is a low for the year, it still indicates that the vast majority of stocks are still locked into strong longer-term upward trends. One surprise for me was that Thursday’s drop in oil did not provide more lift to the market – perhaps the market would have fared even worse if oil had rallied again.
Of course, this technical backdrop is not completely independent of the fundamental headwinds facing the market. Bulls love to say the market climbs a wall of worry…when the market is going up. Bears love to say the worries only matter when they do. It looks like the worries are going to matter for a while. Famed money manager Doug Kass reminds us of the biggest headwinds in “The End of the Trend.” No big surprises here. All but the unrest in the Middle East and North Africa are themes Kass has harped on for many months now:
- Geopolitical worries in North Africa and the Middle East.
- A dysfunctional U.S. government.
- The economy: a lack of corporate tax reform or good energy policy
- Eroding investor sentiment: mainly the poor employment picture combined with rising oil prices (more on sentiment below).
- Tail risks with housing, sovereign debt issues, monetary policy, and, now, technology earnings (for example, see Cisco’s last two earnings disasters and see the dire warnings coming from Finisar (FNSR) about waning demand for optical fiber in China). Perhaps we should also add natural disasters?
You may recall that Kass’s prediction for 2011 was for a sideways market. That scenario seemed lost until this month. While Kass recently printed a “mea culpa” admitting he has been too bearish, in his latest piece, he re-emphasizes his original prediction with vigor. Interestingly, he still sees just 5% downside risk from here. I would say that is pretty good given all potential problems facing markets and the economy. But then again, we have the Federal Reserve’s printing press humming in the background as well…
By the end of February, I noted how the risks to the uptrend were increasing. In that piece, I noted examples of the bull vs bear cross-currents that promised to introduce more churn into the market. On one side, bulls looked at the under-investment of retail investors as evidence of greater potential upside in the market. On the other side, bears looked at the attempt of retail investors to move from under-invested to more fully-invested as a sign the rally had to be getting into its final stretches.
Now add to this mix the news that the positive inflows of retail investors came to a screeching halt last week as oil crossed $100/barrel…this after seven weeks of positive inflows, rare for a market that has seen such little retail participation. I suspected that rising oil prices would discourage investors from buying stocks, but I did not expect such an abrupt change. Regardless, it seems that we retail investors are far from giddy right now.
Be careful out there!
Full disclosure: long SOLR, CSCO
