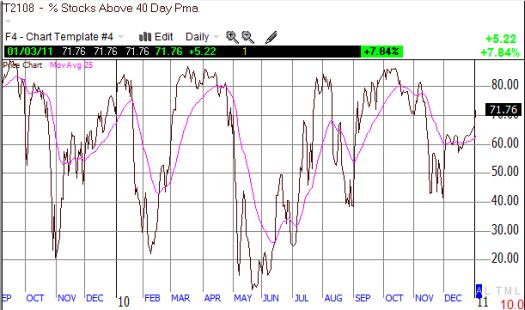
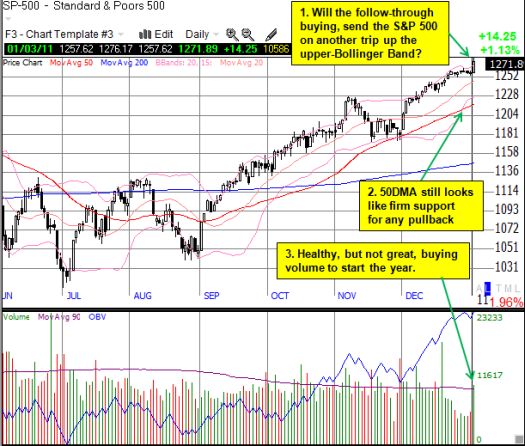
Throughout the stock market’s meandering upward in December, I maintained that technical conditions were not yet overbought. I also noted that T2108, the percentage of stocks trading above their 40-day moving averages (DMAs), would likely not reach the overbought threshold (at least 70%) until a rush of “panicked buyers” sent the market soaring higher. I am not sure whether Monday’s 1.1% gain qualifies as a buyer’s panic (2% or more would have been more convincing), but it was a nice swoosh higher that finally took the stock market over the hurdle into overbought conditions.

Typically, at this point, I advise that this is not the time to open new longs and that some profit-taking is in order. For consistency’s sake, this advice makes sense. I made sure to take some profits, and I have no plans to chase stocks higher from here. However, given the healthy buying volume on Monday, and the nascent migration of cash from bonds to stocks, we likely have all the conditions needed for another extended stay in overbought territory. Recall that ever since the bounce from the March, 2009 lows, the stock market has tended to remain (generally) in over-bought territory for several weeks and up to two months. The last over-bought period lasted an historic 46 trading days.

*All charts created using TeleChart:

Monday’s rally was also consistent with the tendency for months to start strongly. After hearing a host on CNBC quote some study claiming the first of the year is highly correlated to performance for the full year, I decided it is time to republish an update to a review I last did on this topic in 2007. Here are some key findings after I re-examined the data following 2008’s unusual start with a -1.4% sell-off (emphasis added):
“In my last missive, I examined the S&P 500’s one-day performance at the start of each year for the last 57 years of trading. I notice that the overall pattern looked random with no significant ‘fat tail’ on the distribution of returns. I dedicated that missive (and this year) to Nassim Nicholas Taleb and today would surely be a day that would make him ‘proud.’ Today, the S&P dropped a gut-wrenching -1.4%. Over my sample period of 57 years, there have only been 3, yes THREE, other years that started this poorly on a percentage performance basis…
…The years that performed worse than 2007 for the S&P500? A -2% loss on the first trading day for 1980. The year finished UP 28.4%. A -1.8% loss on the first trading day for 1983. The year finished up 19.2%. Finally, a -2.8% loss on the first trading day for 2001. Now THAT was ‘prophetic’ as the year ended down -10.5%. In case you are now building up hope for monster gains for the rest of the year, please note that there is absolutely NO correlation over my sample size between the first trading day of the year and the final return of that same year. In fact, the correlation is 0.08, essentially no correlation. All random.” (Update: I have since recalculated this correlation as 0.14, not 0.08).
So, the correlation is slightly positive, but it is tiny, hardly betting material. This low correlation is partially caused by the random relationship between the direction of the price moves from the first trading day of the year and the end of the year. Since 1951, 44 out of 60 (73%) years have ended with gains. Only half of those positive years started off with a positive trading day. Similarly, of the 16 negative years, only 9 of those years started with a negative trading day.
Interestingly enough, the last three years HAVE shown strong correlation. This correlation has been so strong, that the overall series correlation has gone up from 0.14 to 0.23. This correlation is still too small to form the basis of a trading or investing strategy (except perhaps to create and sell an ETF that trades with this relationship…).
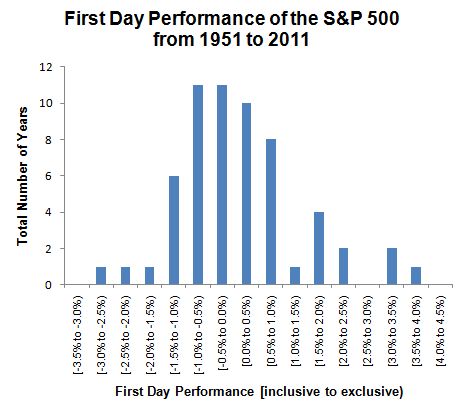
Here is an update on the distribution of gains for the first trading day of the month from 1951 to 2011.

Source: S&P 500 price data from Yahoo!Finance
Be careful out there!
Full disclosure: long SSO puts
