“…I stick by the rule that low-volume buying begets high-volume selling; weeks of gains can be erased within a manner of days once sellers finally get motivated.”
This quote came from my commentary in late March titled “Some Lazy Thoughts for a Complacent Market“. At the time, I was reacting to the extreme overbought technical conditions in the stock market which accompanied a stock market that went up almost every single day on very low volume. I was surprised at the increasing comfort, even excitement, many market observers expressed about the situation.
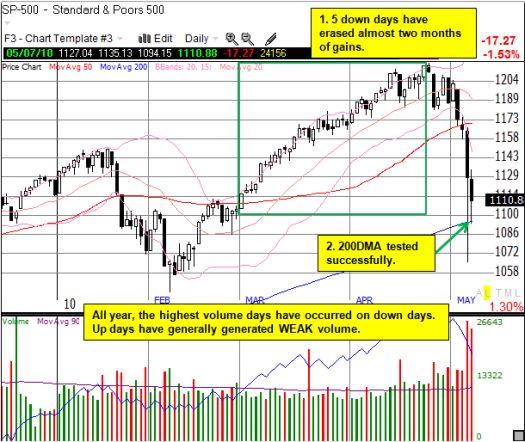
Roll the tape forward to today and what was ignored as just a bunch of bricks for building “the wall of worry” to higher stock prices has suddenly become a cascading shower of cement weighing the market down. (We all know the headlines by now: sovereign debt crisis in Europe and Chinese monetary tightening are two of the biggest). The flip in sentiment has wiped out the entire two-month melt-up of complacency built in the March-April rally in just two weeks. Within those two weeks, it essentially took just five trading days of high-volume trading to erase those gains.
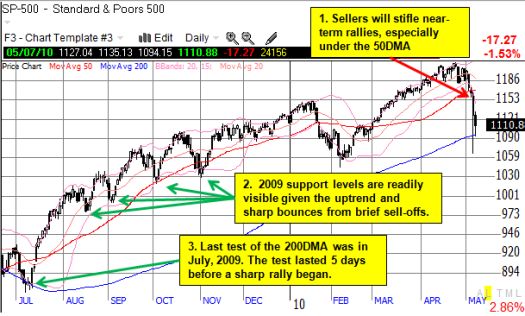
The S&P 500 has tested its 200-day moving average (DMA) for the first time since last July, and oversold conditions have deepened to July’s levels.
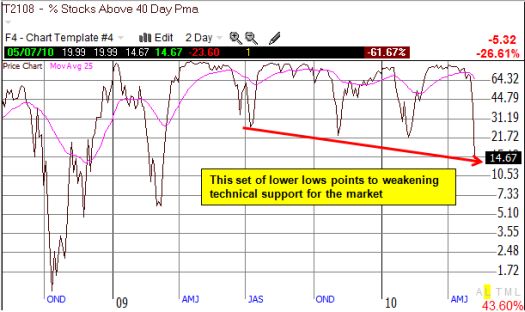
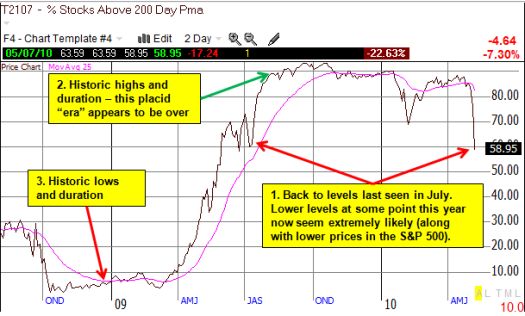
The current charts of the S&P 500, T2108, and T2107 summarize the swift flip in market conditions from overbought to oversold.

The trading action in the S&P 500 once again demonstrates the vulnerability of a market that is not supported by strong buying power. Such a market is full of weak hands that are easily and swiftly shaken once sellers step back into the pits. We saw a similar response to the weak “Santa Claus” rally in 2009 that carried into early January. (Note that high volume buying can also signal a top if the resulting price action goes parabolic. Toll Brothers [TOL] provides the most recent example of this. I posted a note about going short TOL because its recent parabolic trading action finally ended with two strong fades from the highs. The stock has fallen 9% since then).
The good news is that the 200DMA has been successfully tested. Combined with the deepening oversold conditions shown below, there is an increasingly strong case for a short-term bounce. However, I highly expect this bounce to meet significant resistance, especially as the S&P 500 re-approaches the 50DMA (around 1160). After the current oversold period ends, I will be looking for signs that a more extended downtrend has finally begun (the first such sign would be a violation of the February lows).

The percentage of stocks trading above their respective 40DMAs, T2108, has reached levels unseen since March, 2009. At 15%, the market is now deeply oversold. The drop from overbought (70% and above) to oversold (20% and below) only took six days – once again demonstrating the eagerness of traders and investors to unload stocks during the current correction. This dynamic, combined with the lower low in T2108, suggests to me that the market is vulnerable to further declines after the current oversold period ends. Note that I used logarithmic instead of arithmetic scaling to highlight and emphasize the recent trending (I typically use arithmetic scaling since this indicator is bound from 0 to 100%).

Finally, the percentage of stocks trading above their respective 200DMAs, T2107, is flashing more warning signs about the technical health of the stock market. At 59%, T2107 has made the first lower low of the entire rally off the March 2009 lows. These levels were last seen when the S&P 500 last tested the 200DMA in July. I expect T2107 to make even lower lows later in the year. This action would be an important development because the 200DMA defines the long-term trend in a stock; the more time spent trading below the 200DMA, the more downward pressure on the trend.
In earlier posts (for an example, click here) I have described the historic nature of the high levels of T2107 during much of last year’s rally. The breakdowns this year seem to indicate that this placid era has ended. Note well how T2107 flashed warnings in 2006 and then 2007 that the rally at that time was likely coming to an end. (Normal arithmetic scaling for this chart).

*All charts created using TeleChart:

I have accumulated evidence here of growing weakness in the technical health of the market. Under these dynamics, market volatility should remain at elevated levels, providing opportunities to go short AND long as the market bounces more frequently between overbought and oversold conditions. While bears and bulls will be able to make great cases through these swings, I believe that at this juncture, holding stocks for the “long-term” last appeared this unappealing back in 2006 and 2007.
Be careful out there!
Full disclosure: long TOL puts
