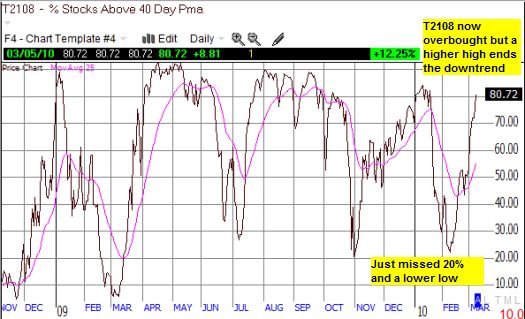
The stock market’s bounce from oversold conditions has been as impressive as almost all other such bounces over the past year. I noted in early February that several technical indicators were pointing to a buying opportunity. One of those indicators, the percentage of stocks trading above their 40-day moving averages (also known as “T2108“), is now flashing an overbought signal. This indicator is typically considered overbought once it hits 70%. The chart below shows that last week T2108 shot right through 70% on its way to 80%.

*Chart created using TeleChart:

Over the past year, the stock market has shown that it can remain overbought for long stretches of time, including a historic reading of 90% on T2108 last April. So, while numerous climactic tops in January convinced me that those highs would hold for many months to come, I am now a little more circumspect after observing the strength of the latest bounce. In particular, cyclicals, consumer discretionary, retail, amongst other economically critical sectors and industries, have already hit fresh 52-week highs over the past two weeks or so. Even Goldman Sachs (GS) finally showed some life finally erasing most of its post-earnings losses with a 5.7% gain over the past two days.
The S&P 500 is now within 1% of its 52-week and 17-month highs. Given the overbought conditions, I still expect some kind of retreat before a direct retest. If the overall bullish tone stays in place, this retreat will be shallow.
Be careful out there!
Full disclosure: long SSO puts, long GS calls
