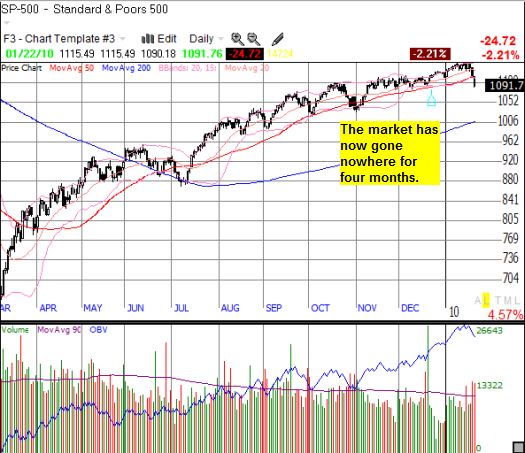
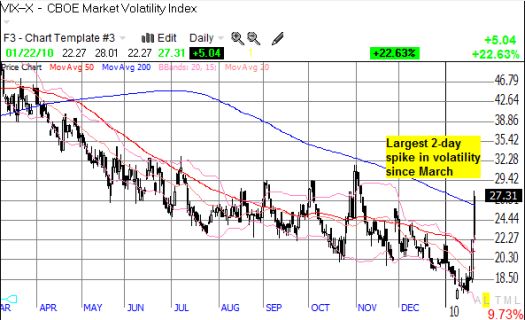
On Friday, the S&P 500 broke down below the 50-day moving average (DMA) on high volume and volatility spiked over 50% during two days of heavy selling (charts at the end of this post). The S&P 500 has been here before. Since the March lows, this is the…
- Fourth break below the 50DMA: previous breaks were in June, July, and October.
- Second high-volume break below the 50DMA: first was in October.
- Second one-day spike in volatility over 20%: first was in October. (The last two tradings days are the first 2-day spike over 50% since the March lows).
The current bearish action is coming during earnings season. Given that the sellers have proven much more enthusiastic than the buyers this year, it is likely that this earnings season will mark the second earnings season since last January that generates a net negative reaction. You guessed it, the first negative earnings season was in October.
So, the S&P 500 has been here before. Each time, the bearish action has been shallow and set platform for the next stage of the rally. In particular, volatility spikes create short-term buying signals, and there is no reason to believe this time is any different. However, after the reaction bounce runs its course, I am expecting the S&P 500 to trade even lower than Friday’s low based on the trend in T2108, the percentage of stocks trading above their 40DMA.
T2108 made a rare plunge of 26% on Friday. Yet, it is still not in oversold territory (20% or below). The trend on T2108 since March is subtle, but it appears to be making lower highs and lower lows. This action suggests that the current sell-off will not run its course until T2108 finally cracks the oversold level for the first time since March. See the chart below:
The S&P 500 is also trading right back to the highs from October – this is the FIRST time during the entire rally that the S&P 500 has gone this long (three months) without a positive gain. I thought the October highs would mark a top in the market based on the selling at the end of October and the first negative reaction to an earnings season. The subsequent rally did take the S&P 500 back to those highs where it churned for around five weeks before the light-volume “Santa Claus” rally finally lifted the S&P 500 to fresh 52-week highs. (Trader Mike gives a good description of the current unwinding of that light-volume rally).
Given the building headwinds in the market (bulls will group them into a wall of worry once the market goes up again) and the series of climactic tops occurring in major stocks and indices (for example, Intel, Caterpillar, healthcare), I suspect that light-volume rallies will cease to work for a good long while. In other words, sustained market rallies will occur only on the backs of strong buying volume. Anything less will be quickly overwhelmed by enthusiastic sellers and shorts alike. This will mark a definitive shift in market mechanics given that volume has not mattered much for most of the rally since March.
Overall, my best guess is that the late December to early January rally represented a false breakout to new 52-week highs. The current correction will lead to some kind of bounce that will not generate new 52-week highs, but it will give way to lower lows on the year; perhaps even a test of the 200DMA. From there, the market (S&P 500) churns and creates some kind of trading range until a fresh catalyst forces the market’s behavior to change (to the upside or the downside – I am biased to the latter but not married to it).
The S&P 500 has been here before…but this time looks different.
The chart of the S&P 500 below shows the rally since March and its relationship to the 50DMA, 200DMA, and trading volume.

This chart of the VIX shows the magnitude of last week’s spike relative to the general downtrend in place since March.

*All charts created using TeleChart:

Be careful out there!
Full disclosure: long CAT calls

4 thoughts on “The S&P 500 Has Been Here Before”