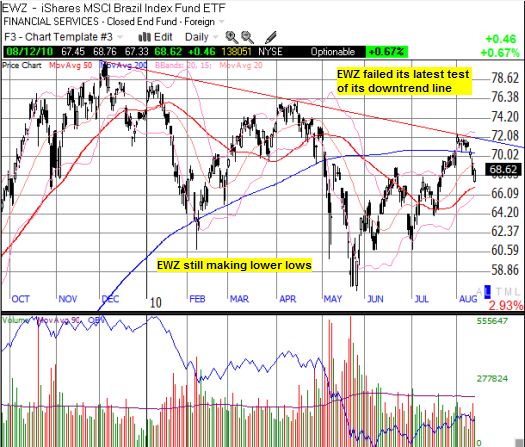
The extended downtrend in the Brazilian ETF, EWZ, remains intact. In particular, over the past 10 months, EWZ has made lower highs and lower lows. The gap up in the beginning of August marked the end of the last rally as it was stopped cold at the resistance from the downtrend line.

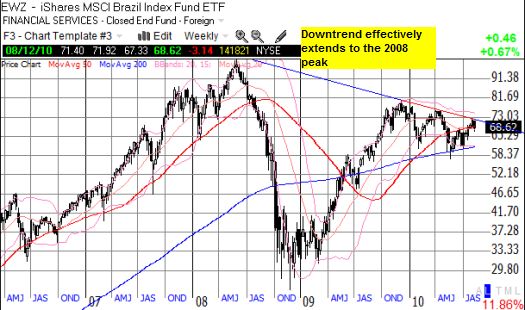
The weekly chart reveals that this downtrend effectively extends to the 2008 peak.

*All charts created using TeleChart:

This multi-year downtrend looks ominous given it appears to project another lower low for EWZ by the end of this year. The positive implication of this line of resistance is that, if broken, the odds will be very good for EWZ to challenge its all-time high from 2008.
My favorite way to play EWZ remains the “20% rule” where I buy on a 20% correction and sell into the subsequent rally. The last time I discussed this strategy, I acknowledged that selling the rallies at resistance also made sense. Given I am still bullish on the Brazilian economy, I prefer to look for buying opportunities, not shorting ones.
Be careful out there!
Full disclosure: no positions
