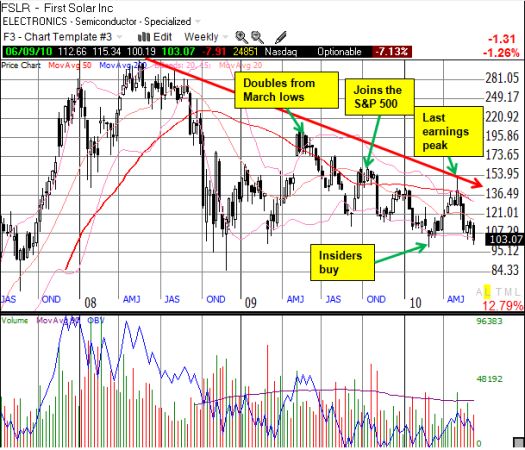
First Solar (FSLR) has been stuck in a downtrend for two years (see chart below). The stock has traveled a volatile path through this trend, providing strong trading opportunities up or down. For example, a sharp two-month rally from the March, 2009 lows doubled the stock price. Insider buying earlier this year provided a convincing catalyst for me to get bullish and suspend any more shorting activity, concluding in an earnings release that sent the stock soaring to its last peak when I went neutral on the stock.
In the middle of this downtrend, the $100 support area has experienced frequent challenges, especially for the six months during the depths of the financial panic. Sharp bounces have followed every challenge of this support. Insider buying met the last challenge. I thought $100 would finally provide a lasting (intermediate-term) bottom, but a little over three months later the stock is right back at support. FSLR hit as low as $100.19 on Tuesday but closed at $104.38. It now sits at $103.07 and seems headed lower.
I would normally be very bullish again at these levels, especially with the general stock market oversold. However, I am guessing the insiders who loaded up on FSLR stock at these levels did not consider just how bad the sovereign debt crisis could get in Europe. They certainly did not consider the possibility that the euro could hit parity with the U.S. dollar over the coming months. There is also the very real possibility that the $100 support area will not trigger the next sharp bounce but instead, FSLR could finally succumb to the overall downtrend, melting away for an extended period (for example, see the bearish wedge pattern).
So, I have taken a cautious approach that I hope will keep me well-positioned for a potential sharp rally while protecting against a very bad drop from here. I added to shares acquired during the recent sell-off and adjusted my put positions by closing out a put spread and adding to June 95 puts. If I am still holding shares in another week, I will establish moderate protection to last through July or August (depending on prices).
The weekly chart below highlights the positive milestones within the overall downtrend. I did not draw a line at $100, but hopefully it is still clear that this persistent overhead downtrend is placing ever firmer pressure on the $100 support area.

*All charts created using TeleChart:

Be careful out there!
Full disclosure: long FSLR (hedged)
