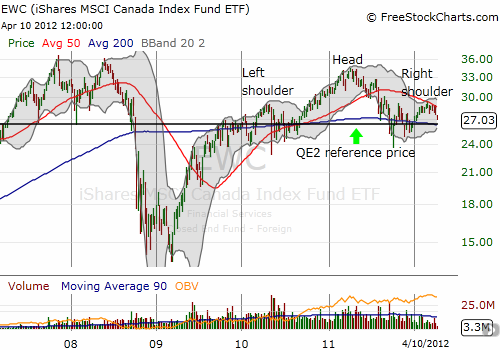
Last year I made the case for investing in Canada in 2012 (see “Buying Canadian On Expectations For Stronger Growth“). I have only made one move since then (buying Encana Corporation (ECA) on weakness in natural gas prices) as I continue to wait for discount prices. I thought just such an opportunity had arrived in the iShares MSCI Canada Index Fund ETF (EWC) as it re-approaches its QE2 (quantitative easing 2) reference price. I define the QE2 reference price as a first buying point for accumulating shares in the midst of any sell-off or crash in commodity prices. I stopped short after noticing a potential topping pattern: the infamous head and shoulders (H&S).

Source: FreeStockCharts.com
The H&S pattern makes EWC look like it made a failed effort to retest post-recession highs. The right shoulder confirms the exhaustion of buying power to make another challenge anytime soon. I almost never short based on a head and shoulders pattern because they seem to deliver so many false signals. The typical trigger for a short is the a break below the neckline of the H&S pattern (see the dark black line). In this case, I am keeping my buying finger on pause for now given the increasing weakness in the market in general. Moreover, current prices only take EWC back to the beginning of the year. With only 7% of upside to the right-hand side of the chart, I prefer to wait for an additional discount to improve the potential risk/reward balance.
Full disclosure: long ECA
