(This is an excerpt from an article I originally published on Seeking Alpha on February 1, 2014. Click here to read the entire piece.)
CNBC’s “By the Numbers” recently reviewed the predictive power of the January Barometer with the following observations:
“The January barometer has been right in 62 of the last 85 years, or 73 percent of the time. Since 1929, the index followed January’s direction 80 percent of the time when it finished positive, and 60 percent of the time, when it finished negative.
More recently, in the past 35 years, the S&P 500 (SPY) followed January’s direction 25 times, or 71 percent of the time…”
{snip}
The past 35 years have been VERY bullish in terms of the number of up years. Thus it should come as little surprise that it is very difficult to find a good barometer for a down year. {snip}
{snip}
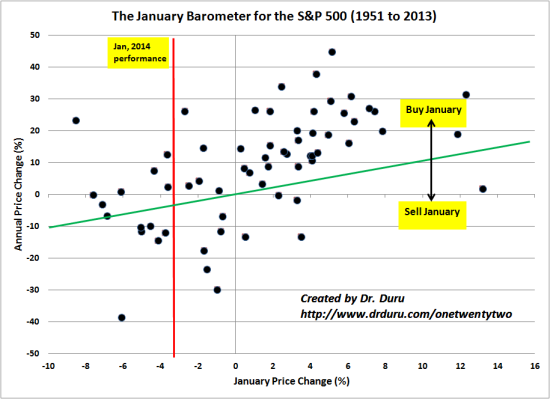
The scatter plot below charts annual price change of the S&P 500 on the y-axis and the monthly price change for January on the x-axis.
The red, vertical line shows where January, 2014 performed. Note that there have only been three years since 1951 where January performed similar to 2014. {snip}
{snip}
The overall correlation between January’s performance and performance for the year is only 0.55 – and remember the annual performance in this correlation includes January’s performance! The correlation between January’s performance and performance for the rest of the year (the remaining eleven months) is ONLY 0.28.

Source for prices: Yahoo Finance
In other words, celebrate when January is up. Cross your fingers (or roll the dice) when January is down…or choose a timeframe for analysis that makes you feel more comfortable.
{snip}
Be careful out there!
(This is an excerpt from an article I originally published on Seeking Alpha on Feb 1, 2014. Click here to read the entire piece.)
Full disclosure: long SPLV, SPHB; long SSO calls and puts
