Elon Musk took a small hit on his two high-flying darlings Tesla (TSLA) and Solar City (SCTY) in the wake of recent earnings. Both represent some intriguing technical trading opportunities that I review in brief here.
Tesla (TSLA)
I used twitter to talk about Tesla pre and post-earnings. On Tuesday, November 5, I noted a huge volume surge in TSLA weekly $150 puts (hat tip to a friend of mine).
No wild after hours trading for $TSLA post-earnings. Just straight down. Massive vol on weekly $150 puts so MMs likely to make a stand there
— Data-driven $$$ (@DrDuru) November 5, 2013
I continued following the drama today (Nov 6th) with these $150 puts and tweeted frequently. First I was surprised that TSLA opened without breaking to a fresh 1-month low. Next, I was surprised that the stock managed to break the $150 level to the downside. Finally, I was surprised that the stock was able to come back from that breakdown to finish above $150. In the process those weekly $150 puts ranged from about $0.93 at the lows to $6.40 at the highs! In the end, the puts closed up 63%. The MMs (Market Makers) have a lot of work to do to snatch profits out of those puts!
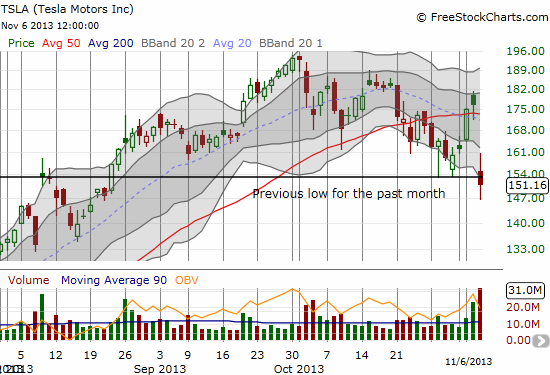
While watching the puts, I almost missed two things that indicate a sustained downtrend could be forming on Tesla. On the daily chart below, you can clearly see how TSLA is generally following the lower-Bollinger Band lower. The pop ahead of earnings was a huge fake-out. I added a line at the previous 1-month low to show how TSLA opened with some hope to avoid a breakdown, only to get rejected at the top of the downtrend channel and then trade to a near 2 1/2 month low.

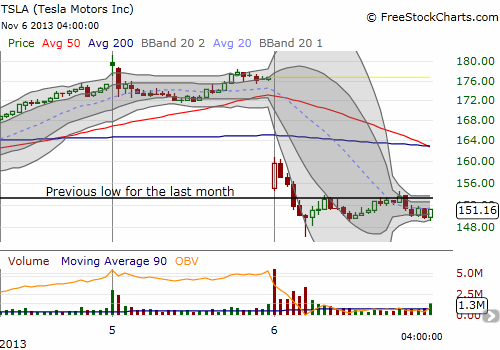
In the process of this bouncing around, the old 1-month low eventually became resistance. The intra-day 15-minute chart provides a close-up to some important technical action. The intial bout of bottom-fishing on the stock lasted only 15 minutes. After TSLA set a new low for the past month, the selling soon climaxed at $146.36. From there TSLA made two valiant attempts to break the resistance at the old 1-month low but failed. I am now watching this level like a hawk. A break to the upside may have me trading for a quick bounce. Follow-through selling will confirm the unfolding downtrend.

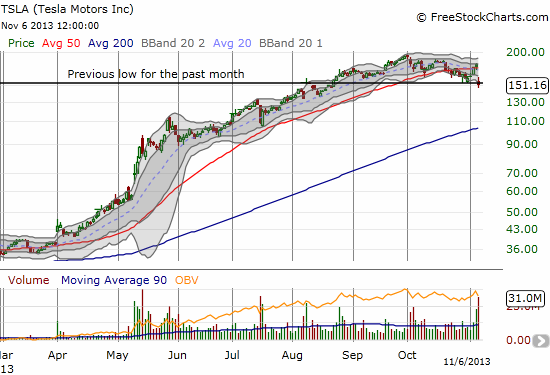
Finally here is a 1-year chart for most of this year as a reminder that TSLA’s current troubles are still a drop in the bucket relative to this year’s gains. Also note how TSLA traded below its 50DMA for the first time since March. Since then, not a single downtrend unfolded like the current one. Given the previous uptrend, the only “natural” support rests at the 200-day moving average (DMA)…which happens to float right above $100, a source of brief congestion back in June.

Solar City (SCTY)
I wrote about the pre-earnings opportunity for SCTY in “Solar City Pre-Earnings Technical Review – November, 2013 Edition.” In that piece, I presented a case for expecting SCTY to trade up post-earnings if it moved much at all. I tweeted just ahead of the close of trading that the market would not give me my price selling puts, so I stood on the sidelines of the trade. SCTY traded down as much as 10% in after hours trading, so of course I felt a little relieved that the trade never executed. I was reminded why I was targeting a sufficiently high price on selling the puts: I needed compensation for some downside risk in case my pre-earnings trade ended up on the wrong side of the fence. At its current point, my trade would register a small loss.
While SCTY has no natural support until around $44 where the 50DMA resides, I am preparing to sell puts as a continuation of my original pre-earnings trade idea. If SCTY can actually trade down double digits in the wake of all four of its earnings reports, perhaps it can also pick up the pieces for a fourth time and eventually launch into a fresh rally. I will be reaching for some time premium to give this one time to work its way
Be careful out there!
Full disclosure: no positions
