
(This is an excerpt from an article I originally published on Seeking Alpha on October 29, 2012. Click here to read the entire piece.)
“If Amazon were an ordinary company, investors would long ago have strapped its management to a rocket ship and sent it far, far away.”
From “Amazon and Its Admirers Shrug Off Report of a Loss as Sales Keep Climbing“, NY Times, October 26, 2012
By now, the resilience of Amazon.com (AMZN) should be legendary. AMZN is a company that generates large amounts of revenue and very little profit. Yet, the stock has staged an incredible comeback from the burst of the tech bubble…{snip}

{snip} As the New York Times stated: “What separates Amazon from the competition is that it is not trying to make money. It is instead trying to grow as fast as it can, something it has been doing successfully for 15 years.”
")
Source: MSN Money Ten-Year Summary
The third quarter’s net loss was Amazon’s first in nine years but seems consistent with the annual trend in place since the recession. {snip}
On top of the rare loss, AMZN guided down for Q4 revenue and operating income… {snip}… So, it was no surprise when AMZN’s stock quickly dropped as much as 9% in after hours to print almost $200. However, as is so often the case with AMZN, this dip turned into an instant buying signal.{snip}

Source: FreeStockCharts.com
Since the beginning of this year, I have advocated a strategy of buying AMZN immediately at the open the day after reporting earnings. {snip}
Finally, I am updating the overall post-earnings analysis for AMZN. {snip}
Click for a larger view…

Source: Price data from Yahoo!Finance
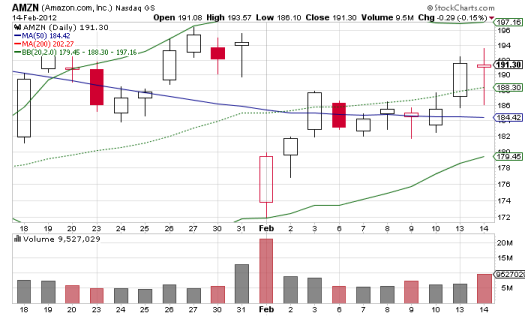
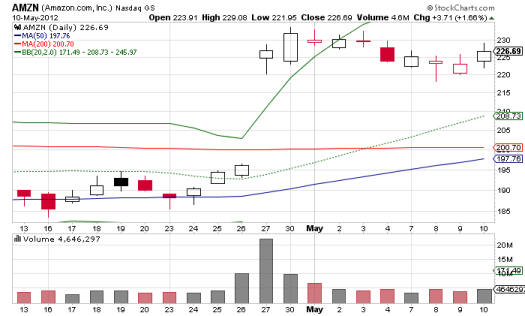
CHARTS FOR AMZN EARNINGS SINCE 2009
2009 Q1

2009 Q2

2009 Q3

2009 Q4

2010 Q1

2010 Q2

2010 Q3

2010 Q4

2011 Q1

2011 Q2

2011 Q3

2011 Q4

2012 Q1
2012 Q2
2012 Q3
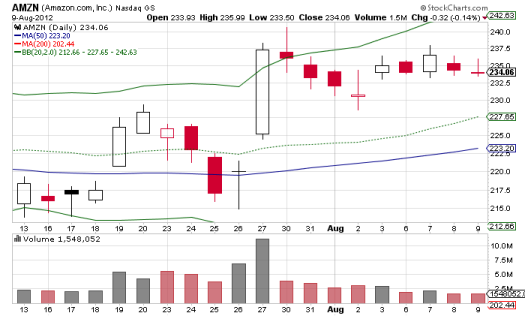
Source for charts: stockcharts.com
Be careful out there!
(This is an excerpt from an article I originally published on Seeking Alpha on October 29, 2012. Click here to read the entire piece.)
Full disclosure: long AMZN