(This is an excerpt from an article I originally published on Seeking Alpha on August 10, 2012. Click here to read the entire piece.)
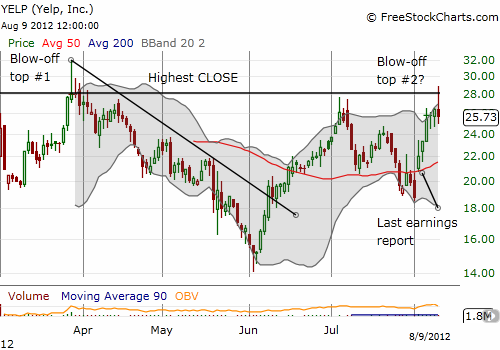
{snip}…The chart below represents all of YELP’s trading history to-date.

Source: FreeStockCharts.com
The chart cannot show the magnitude of the trading volume given the large distortion from the first day of trading. The 1.8M shares traded was twice the 3-month rolling average (an intraday chart shows volume surging into the highs and off the highs of the day). This kind of massive reversal on high trading volume at an important high price point is typically a sign of a blow-off top. This is a moment where the last enthusiastic buyers rush in to buy into a story, momentum, etc.. exhausting the roster of new money willing to take the shares ever higher. Encroaching upon the vacuum is a trading/investing base that is dominated by people eager to take profits.
YELP experienced a blow-off top on March 28th as well. {snip} I can identify the blow-off top earlier this time because there is an easy reference point now in the all-time closing and intraday highs.
YELP last printed a strong sell signal when it rallied right into the closing high before fading away from it. I described those dynamics in “Back Into Puts As Yelp.com Fails to Establish New Highs.”
{snip}
Be careful out there!
(This is an excerpt from an article I originally published on Seeking Alpha on August 10, 2012. Click here to read the entire piece.)
Full disclosure: long YELP puts
