(This is an excerpt from an article I originally published on Seeking Alpha on April 9, 2012. Click here to read the entire piece.)
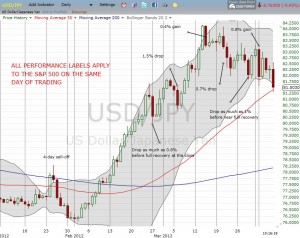
In tweets and various posts, I have harped on the renewed strong relationship between yen strength and market weakness. In “Weakness in the Japanese Yen Is Over for Now, Part Two“, I updated an overlay of the USD/JPY, the U.S. dollar vs Japanese yen currency pair, and the performance of the S&P 500 (SPY) on key days of yen strength:
Click image for a larger view.

Source: FreeStockCharts.com
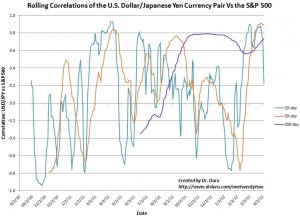
After quantifying the specific correlations at work between USD/JPY, the inverse of the Rydex CurrencyShares Japanese yen Trust (FXY), and the S&P 500 (SPY), I discovered a few surprises that I believe could imply sustained weakness in the stock market going forward.
{snip}
Click image for a larger view.

Several notable features of these relationships stand out to me:
{snip}
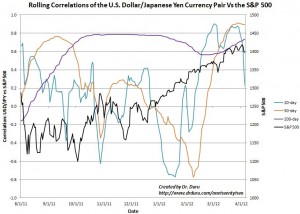
Given the S&P 500 last peaked on May 1st of last year, it is very tempting to wonder whether the current ending of the high correlation is signaling another imminent top in the S&P 500. {snip}
{snip}
Click image for a larger view.

The current data suggest that any relationship between these correlations and the subsequent behavior of the S&P 500 represent sufficient conditions but not necessary ones. The question to ask is why would or how could such a high correlation be related with an imminent change in the prevailing trend in the S&P 500? I like to think of these dynamics as representing a reversion to some “norm.” {snip}
Be careful out there!
(This is an excerpt from an article I originally published on Seeking Alpha on April 9, 2012. Click here to read the entire piece.)
Full disclosure: long USD/JPY, long SDS, long SSO calls
