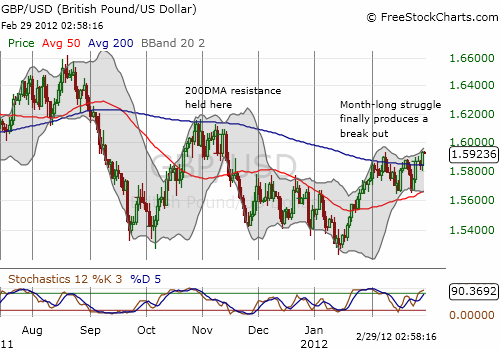
On Tuesday (February 28), the British pound finally broke out against the U.S. dollar with a resounding surge above its 200-day moving average (200DMA). The struggle to break this resistance lasted the entire month of February.

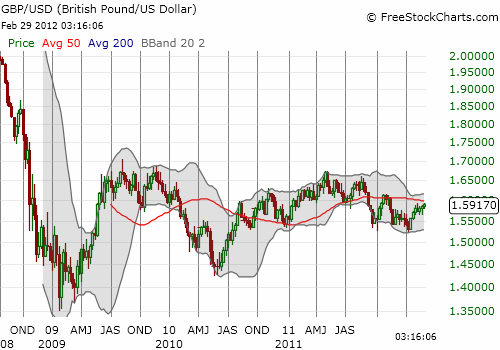
Despite this technical breakthrough, I remain skeptical that the British pound will deliver much follow-through before faltering again. Indeed, I am using this rally as an opportunity to start rebuilding a short position in GBP/USD – the ETF equivalent is the Rydex CurrencyShares British Pound (FXB). I am playing this short until/unless GBP/USD breaks the highs from last Fall around 1.615. I am not being stubborn just because back in November I projected the British pound to crater to major lows (see “British Pound Headed for Major Lows Versus the U.S. Dollar“). Instead, I still expect that the Bank of England (BoE) will continue to seek to devalue the pound in support of its own economic recovery. Since the Spring of 2009, the pound and the U.S. dollar have passed the baton of devaluation back and forth numerous times. The weekly chart below shows how opportunities abound for bears and bull alike over this time span.

I took careful note during the Bank of England’s last Inflation Report when Mervyn King marveled at how the pound’s currency index dropped 25% without generating a significant decline in real wages. I take this to mean the pound still has plenty of room left to fall to solidify the kind of economic rebalancing that King believes is necessary for the United Kingdom to achieve appropriate levels of global competitiveness.
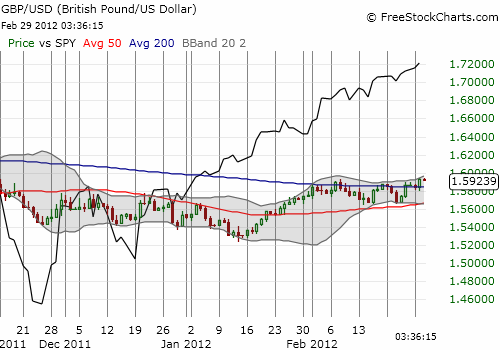
I do recognize that a bearish bias is the near equivalent of a bearish bias on the U.S. stock market. The year-to-date daily correlation between the S&P 500 and GBP/USD has been a relatively high 0.79. This correlation was strongest during a two week stretch in January when the British pound consistently gained against the U.S. dollar while the S&P 500 was also streaking upward (see chart below). Still, I am OK with this bias given the stock market is at historic overbought levels.

Source: FreeStockCharts.com
Be careful out there!
Full disclosure: short GBP/USD (partially hedged for now with long $GBP/JPY and long $GBP/CHF), long SDS
