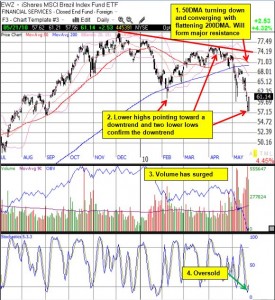
So far this year, EWZ has experienced two 20% corrections from previous highs. The last correction ended in February along with most major stock markets. In late January, I recommended buying EWZ for a trade once it tested its 200DMA. That point of support marked a 20% correction, and it also coincided with the August, 2009 highs. EWZ successfully tested is 200DMA and provided an excellent bounce for the triggered trade.
I could only recommend a short-term trade because the overall technical outlook on EWZ had turned negative: a potential head and shoulders top and a likely break of the October lows. EWZ has once again corrected 20% from its recent highs and so triggered a buy signal on Thursday around $59 just as the stock market was reaching extreme oversold readings. Many stocks and indices generated likely reversal signals on Friday by generating bullish engulfing patterns; EWZ was fortunate enough to do the same. This strengthens the case for a good, tradeable bounce in EWZ.
The looming downtrend in EWZ is once again tempering upside expectations for this trade. EWZ’s last high was in April, forming a lower high, and last week’s new low generated a second lower low. An overall downtrend for EWZ is further confirmed by a declining 50-day moving average (DMA) which will soon converge with a flattening 200DMA. The upper price target sits around $68, a reversal of all recent losses and a point that sits directly under likely resistance. With a stop directly under Friday’s bullish engulfing pattern, the risk/reward on this trade looks very good. (Note that I have not ever gone short on EWZ because I remain bullish on the “Brazil story” – for now).
The chart below summarizes the set-up and longer-term outlook (click for larger view).

*Chart created using TeleChart:

Be careful out there!
Full disclosure: long EWZ
