Not only did we get an unusual start to the trading year, we got a complete bomb. For the 5th or 6th time in the last 18 months, recession-related fears have taken the market for a wild ride. It has been tough for me to keep up with the latest madness, but I feel compelled to try to jot down a few notes because on Tuesday the S&P 500 finally broke those magical November lows. This technical failure has flipped me from being a bull waiting for the bears to prove their points to a bear waiting for the bulls to prove themselves again. The market rallied strongly from those lows on the back of a Fed lovefest, and at the time it looked like that could be the launch point to new 52-week highs. Instead, it became the next line of support to test. That support held for two days before cracking. Even worse, we have now developed resistance directly overhead on the S&P 500 and the NASDAQ. Indeed, Wednesday's late-day snapback rally took the S&P 500 right back to the November low...and just in time for shorts to cover ahead of another Ben Bernanke yap session on Thursday. And how appropriate for us to get our first up day of the year on the NASDAQ (after 8 straight down days) on a day Goldman Sachs added to the cat calls for a recession.
There are three key differences to this latest recession scare: 1) The Fed has been actively trying to fight off economic and market weakness (to no avail yet), 2) we now have a labor market that is finally showing signs of real weakness based on last Friday's job report, and 3) numerous analysts and pundits have declared that the U.S. has actually already entered a recession. This means that the financial markets will be even more on edge than usual as earnings season storms through this month. Let's take a tour through a few snapshots to demonstrate the market's jitters and extremes in price movement.
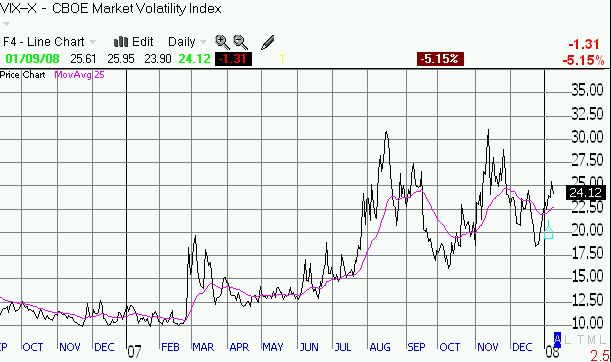
You would think with all the selling to kick off 2008, we would see a spike in volatility readings. Not so. Although the long-term picture surely indicates that the multi-year decline in volatility finally ended in early 2007 (I first noted this potential development last July), the current move upward in volatility has not even come close to the last two sell-offs of 2007. This warns me that we may have much more downside to go before any sustained rally takes place.
My favorite indicator T2108, the percentage of stocks above their 40-day moving average, has also barely budged throughout this drama (see TraderMike's Jan 7th post) - adding to my concern that a re-test of 2007's lows in March loom over our near future. My review of the "evidence for a tiring bull" remains timely as the T2107, the percentage of stocks above their 200-day moving average, continues to test the lows of 2003 and seems ready to resume a slow and steady march back to the nauseating lows of 2002.
One of the questions to ask ourselves is "who's not coming back on the coattails of the next rally?" In 2006, housing stocks benefitted with each sharp rise in the market. In 2007, they consistenly went lower after the start of each market bounce. This year may be no different. The sell-off of 2008 was just as relentless as ever on the housing stocks. The XHB, the ETF for homebuilders, is already down a whopping 17% for the year! For example, Toll Brothers (TOL) made a fresh four-year low this week, and it's now working on 5-year lows. See the monthly chart below:
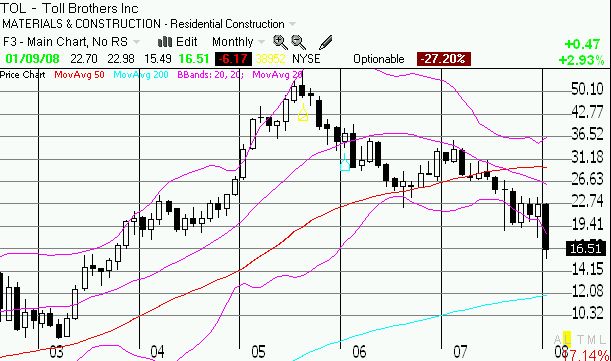
Treasury Secretary Henry Paulson appeared on CNBC on Tuesday and offered this grim view on the housing market: "There's no evidence that it's improving or bottoming and I think the evidence would indicate that it's got further to run." Paulson can slide on down the deadly downtrend in the charts of the homebuilders: the technicals concur with Paulson's assessment. I am reminded of how sour things must be every time I walk around the neighborhood and see the same "for sale" signs month after month on about 10% of all the homes in my sub-division. Yikes. We also have fresh talk of bankruptcies. Looks like Wci Communities (WCI) may be the first of the major builders that I follow to succumb. The stock fell a whopping 53% to $1.50 on Wednesday. Hard to imagine that just last year Carl Icahn wanted to buy these guys for $22 and management decided the price was not high enough. Lesson learned? I suspect next on the list will be Beazer Homes (BZH).
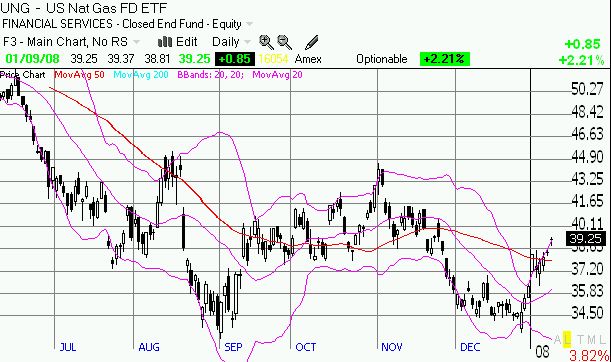
Oil has been happily oblivious to all the turmoil in financial markets. In fact, oil has flirted with $100 to start off the new year. Now, there is an interesting parallel between oil and stocks. Do you remember what oil was doing this time last year? It was selling off hard and fast. It went straight down almost every day for almost three weeks before bottoming for the year. The bulk of the gains in oil have come since August. I cannot imagine that oil can power on even further while the market is convinced that recession is right around the corner. Of course, supply shocks can easily throw any theory out the window, but unlike times past, I cannot remain bullish on oil at these levels and under the current macro-economic backdrop. However, I am VERY curious about natural gas (UNG) because it looks like these high oil prices have finally put a spark in the step of natural gas - despite unseasonably warm weather this winter in much of the country. There is still a lot of overhead resistance above, but if natural gas clears the spikes in August and November, it could be off to the races from there.
Remember last year when we were wondering whether the multi-decade decline in interest rates was finally coming to an end? Scratch that. Back in July, I decided that the long-term downtrend looked ready to resume. I was "more right" than I could imagine. Six months later the downtrend has proven well-intact and even the shorter-term up-trend from 2003 is now broken. The chart below includes the old trendline from last year.
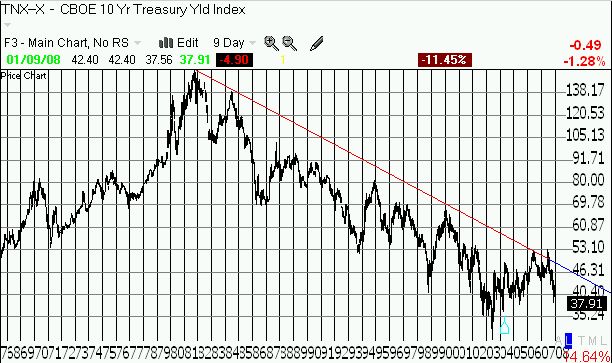
Rates have fallen so low because of a "flight to safety" as market participants scramble to prepare for a recession. The market is also anticipating more Fed easing - or at least it is trying to force the Fed's hand to ease. As we know from previous missives, this multi-decade decline in rates is probably one of the main drivers of the bull market that has spanned that same amount of time. There is a lot of vested interest in keeping the momentum going! Note well that the current decline in rates has not helped housing one iota.
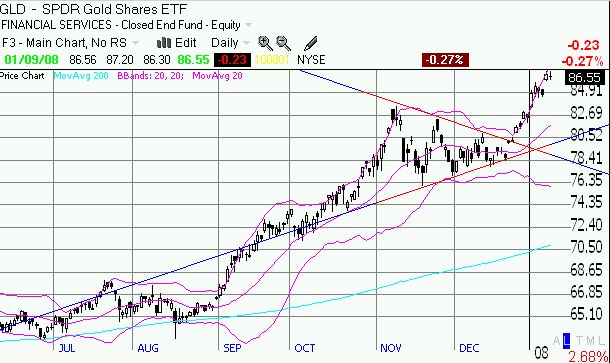
As the Fed is forced to keep pushing inflation risks as far as they can stretch the government numbers, gold has enjoyed some fresh leaps upward as every bear's favorite hedge against paper money. There have been a lot of doubters. Many I am sure figured $700 and then $800 would be tops. Gold has now doubled in just 2 1/2 years, and we are now eyeing $900 and $1000. The chart below shows a nice bullish flag that developed for gold that preceded the current break-out and run to $900. I am sad to report that I dumped my last gold holdings in the middle of that consolidation period and have been on the sidelines of the current move. I am waiting for the next sell-off to start nibbling away again.
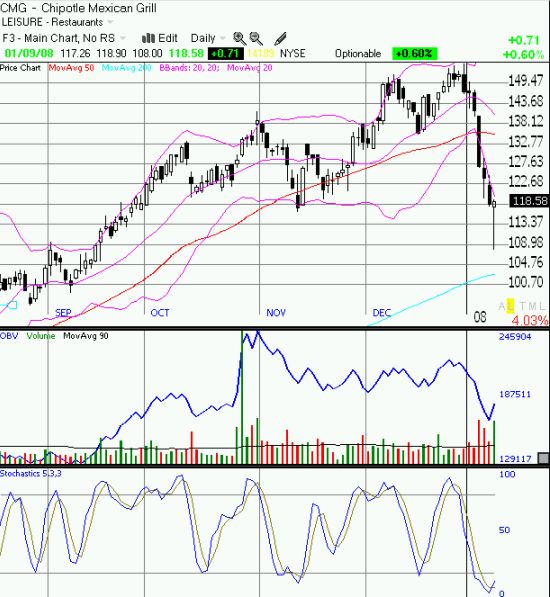
And how much fear is out there regarding recession? Tech and most growth stocks have seen massive selling pressure. These were last year's winners and people feel free to take their profits now that they can log them in the new tax year. But there also have been some wicked moves in consumer discretionary names. These kinds of moves frustrate bulls to no end because they spend months slowly building up profits only to see them vanish in a number of days. Chipotle Mexican Grill (CMG) combines consumer discretionary and growth stock all in one, so I thought I would show its chart as an example. In 6 days, CMG erased 6 weeks of gains. The ugly jobs report last Friday pounded CMG for a one-day loss of 10%. The stock closed Wednesday right at the critical November lows, but it had to rally 10 points, almost 10%, mostly in the last 90 minutes of trading to pull off the "victory." I will not be surprised to see a test of the 200 DMA soon and perhaps even the nice round number of $100. CMG is now already down over 20% on the year, and at Wednesday's lows it was down about 27%. Now that is some recession-driven selling! After all, people believed that CMG was the one growth story left in the entire restaurant business. CMG has still doubled in a year, so a lot of people are sitting on profits...nervous profits. Finally, notice the stochastics are screaming "oversold," so we should not be surprised to see a bounce over the next week or so. But look out for the test of overhead resistance at the 50 DMA.
The list of interesting and telling charts goes on and on and on. By the time we can absorb everything, the market will surely have moved on to another stage. The current selling has perhaps lowered expectations enough for earnings that we might actually get some kind of rally on news that is not as bad as expected. Some friendly Fed words could even help, but given the Fed's recent lyrical failures, I would not bet on it. Regardless, I will be the first word of caution after the Fed meeting at the end of this month. It is clear that the Fed cannot provide a quick fix to our current financial problems (has it ever?), and the market's disappointment over this sinking realization can also sink stocks all over again.
Be careful out there!