On Thursday, September 15, investors and traders dumped Netflix (NFLX) on news that the company will lose 600,000 subscribers this quarter compared to the previous quarter. In 12 years, NFLX has now suffered a quarter-over-quarter loss in subscribers only twice. This occurrence represents a 2.4% reduction in customers. (For more details see AP story “Higher Netflix prices equals fewer subscribers.”).
NFLX’s stock closed the day with a 19% loss and put an exclamation point on a string of bad news flow for the past several weeks. The last big drop came on September 2 when NFLX lost 9% on the heels of news that it could not come to terms with STARZ to renew its contract for movie streaming. Rumors also circulated that DISH network is planning to use its acquisition of Blockbuster to launch a rival movie streaming service (see “Dish Said to Stream Blockbuster Films to Challenge Netflix“).
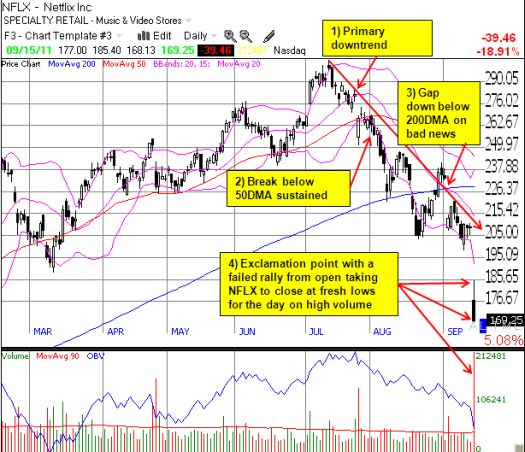
As the news flow deteriorated on NFLX, so did the technicals on the stock. The chart below highlights all the warning signs that led up to yesterday’s collapse. (Note that I purposely drew the downtrend line through the temporary rally back above the 200DMA to emphasize the primary downward momentum).

The poor trading action on yesterday’s 19% decline indicates that the weakness in NFLX shares will very likely persist for some time to come (at time of writing, NFLX has lost another 4%).
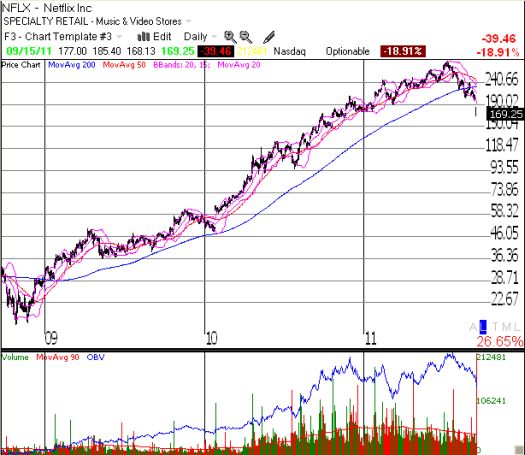
NFLX also broke down below its 200-Day moving average (DMA) twice in the last month. The chart below shows that until August, the 200DMA was a reliable guide to an incredible uptrend for NFLX.

*All charts created using TeleChart
NFLX has been on my list of high-tech stocks to short as a hedge against an overall bullish trading portfolio (as detailed in my regular “T2108 Updates“). I closed out the latest (and most successful) position yesterday. With all the indicators pointing to more downside, and given there appears to be a LOT of potential to roll back significant portions of an almost three-year run, NFLX goes right to the top of this list. (See “Netflix in ‘the Perfect Storm’?” for a fundamental bear case targeting downside to $110).
Be careful out there!
Full disclosure: no positions
