The shorts in Cisco (CSCO) had it right after all…even if they were a bit early.
Short interest in CSCO surged in late August close to 52-week highs. When I noticed this in mid-September, I made a somewhat complicated case for using this as a contrarian signal to go long the stock. CSCO trickled upward with the market, but by early October I recommended that it was time to end the trade:
“…CSCO has lingered at resistance for over a week, apparently lacking a catalyst to move higher. CSCO’s 10% performance on the month fell short of the NASDAQ’s 12% gain on the month. Moreover, the NASDAQ has cleared important resistance at its June highs whereas CSCO is still struggling to fill its post-earnings gap-down from August. If the general stock market remains bullish, CSCO could continue drifting higher, but it is difficult to make a case for a change in the poor relative performance. So, it makes sense to look elsewhere for bets on tech.”
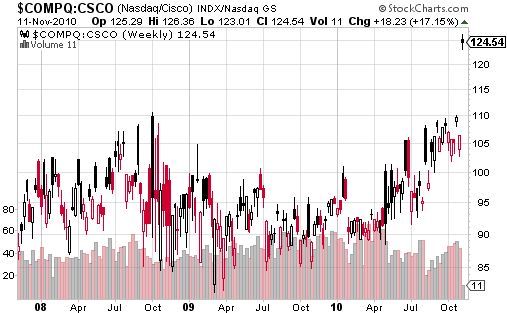
Given CSCO’s revenue warning for FY2011 ($43.6-44.8 billion was below the $45.28 billion analyst consensus), the relative under-performance now makes sense in hindsight. The interesting twist to this story is that CSCO’s October under-performance had not been seen since the crash in the fall of 2008 (see chart below). If I had noted this before earnings, I would have guessed that CSCO was about to “revert to the mean” – that is begin a period of out-performance relative to the NASDAQ. I have made similar calls in other trading pairs.
Instead, CSCO’s 16% post-earnings drop sent the stock’s relative performance to its worst levels since early 2006 (not included in the chart) and close to the 52-week lows from the end of August (where shorts stampeded into position). The incredible 553 million shares traded Thursday were the third highest in CSCO’s 20-year history as a publicly traded stock. The two higher days: 701M on November 8, 1990 when CSCO recorded a 20% GAIN on the day; and 807M on May 13, 1994 when CSCO lost 20% for the day – CSCO bottomed two months and 16% in more losses later. (Note that as of October 29, total shorts in CSCO were 46.6M shares, just 0.8% of float and 11% below August’s surge to 52.4M shares short.)

Source: stockcharts.com
Despite all this, I decided to nibble on some CSCO stock as an eventual recovery play. I tucked it tuck away into a deep, dark corner without any targeted timeframe for this recovery. Later, I was gratified to read in briefing.com that John Chambers claimed in a CNBC interview that the company will aggressively buy back stock once it can return to the market. I am hoping today’s reduction in guidance is tomorrow’s eventual opportunity for upside performance.
(Comedy sidebar: Jim Cramer throws a fit and practically labels Cisco an evil company based on its performance for the quarter – click here for video).
Be careful out there!
Full disclosure: long CSCO
