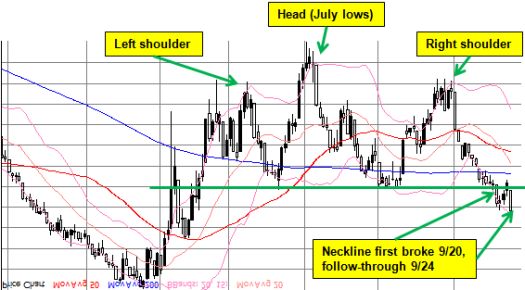
Over the last few months of tracking the S&P 500 I have not given much thought to the “reverse head and shoulders” (H&S) pattern. It is now time to pay attention. Friday’s continuation of the current rally is not just part of a steady uptrend from the August lows that has successfully punctured through important resistance levels (the 50 and 200DMAs AND the June highs), the rally is also a follow-through on a breakout (or breakdown?) from the reserve H&S. I have flipped over a chart of the S&P 500 to describe the contours of what has happened. I left out as many labels as I could because reading those upside-down was making me dizzy:

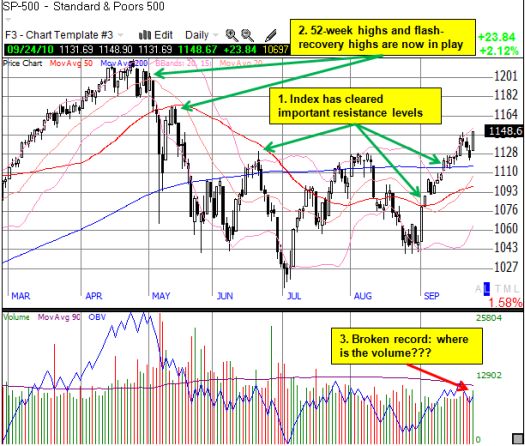
In short, the sellers were able to generate enough momentum to achieve fresh lows in July, but they failed to do so in August. This failure has given way to the buyers (the few that are out there) who have now won back control of the price momentum. Their “victory” is confirmed by the break-out. Follow-through and confirmation are key ingredients to interpreting any technical pattern, and the market has achieved it here. What the market continues to fail to achieve is meaningful trading volume. This follow-through should have attracted a surge in volume as buyers rush in to hop on the bandwagon and join the excitement. While volume was the highest for the month, it was roughly equal to the selling volume on Tuesday and still below late summer volume in August.
The chart below shows that the market is now “all-clear” to retest the recovery from May’s “flash crash” and retest the 52-week highs from April.

*All charts created using TeleChart:

The anemic volumes make this rally quite similar to the rally that led to the April highs. Unless some material change happens soon, I expect this rally to end roughly the same way. Adding to the rally’s unattractiveness, T2108, the percentage of stocks trading over their respective 40DMAs, is back above 80%. The market is now at day #12 above the over-bought threshold of 70%. Roughly 80% of all such over-bought periods end by now.
A very key difference from the Spring to now is that the November elections provide a palpable and powerful catalyst for buyers. This election is being (over)hyped as one of the most important in American history. This means that politicians will be more prone than ever to generating messages advertising more than they can realistically deliver – messages that will under-emphasize the structural, long-term nature of our problems, and over-sell the effectiveness of a whole host of short-term solutions that promise immediate relief to a weary population. Layer on a Federal Reserve that has promised to rain even more dollars on the economy if conditions do not soon improve, and, suddenly, we get one potent mix of rocket fuel.
In other words, this will be a tough market to handle (like it was ever easy, right?). The benefit of the doubt goes back to the bulls, but at any time, this whole thing can come apart because it is not a healthy rally. It is also difficult to short until some new catalyst looms in the wings. The massive amount of short interest on the NYSE indicates there are plenty of traders who believe such a catalyst is already there, but the market may not turn downward until these bets start closing out.
Be careful out there!
Full disclosure: long SSO puts
