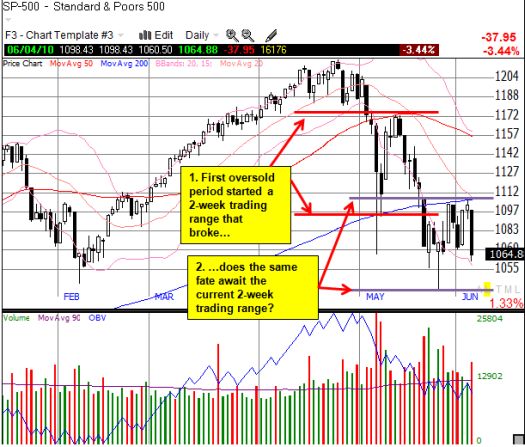
As I feared might happen, the stock market has already fallen back into oversold territory as measured by the percentage of stocks trading above their 40-day moving averages (DMAs). This indicator, T2108, dipped under 20% and closed at 18.5%. This is the third oversold period in just a month, and this third time is not a charm.
This density of oversold readings reminds me of the market’s behavior as the last bull market neared its end. Back in July, 2008, I charted the start dates of all the oversold periods since 1986 and was surprised to see the increasing propensity of oversold periods starting in 2005. At that time, I could not fully appreciate the potential meaning of this correlation, but today, I am extremely wary now that a similar pattern potentially unfolds. (Coincidentally, the S&P 500’s peak in April of this year occurred directly above its prices during the March, 2005 oversold period).
Of course, the S&P 500 continued to run for 2 1/2 years, defying all expectations of the bears for the market to crater in rapid response to the peak of the housing bubble. So, I cannot say that the current crowding is a strong sell signal. I can only say for now that the more frequently the market prints these oversold periods, the more convinced I will become that the bounce off the March lows is finally grinding to a halt. Note well that the S&P 500 has gone nowhere for 8 months and counting.
In line with my increasing wariness, I am much less inclined to treat this third round as a golden buying opportunity for a short-term trade. The S&P 500 has bounced within a wide range two weeks – exciting bulls and bears alike on each move consistent with their respective theses. However, these trading conditions are unlike any we have observed during the past 15 months. For example, not only has the market’s weakness now out-lasted any other correction since the March lows, but also the S&P 500 has traded below its 200DMA and consistently failed to break above this resistance. A retest and break of the February lows seems almost like a lock. This first lower low since last July would likely take T2108 below the last low of 10% – consistent with my expectations for steadily worsening market technicals.
In other words, I am now transitioning my interest to fading rallies into resistance rather than buying dips into oversold territory.

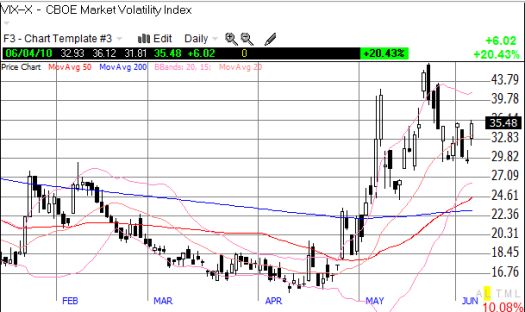
The biggest outstanding question is the VIX. While I speculated that volatility would remain elevated, I was expecting the VIX not to bottom until reaching support at the 50 and 200DMAs. If the VIX does not come back down quickly, a retest of the recent highs seems very likely – again, consistent with a break of the February lows. Now THAT should be a buyable event.

*All charts created using TeleChart:

Be careful out there!
Full disclosure: long SSO

1 thought on “This Third Oversold Period Is NOT A Charm”