Share Click here to suggest a topic using Skribit. Search past articles here.
Last week, I laid out the case for making a Buffet-like bet on Goldman Sachs (GS) using LEAP (Long-term Equity Anticipation) options but decided to stay on the sidelines. This past Tuesday, I decided to check in on the action in Goldman and noticed exceptionally high trading activity in the Jan 2010 calls with a $110 strike price. 1006 calls exchanged hands with an open interest of 1979. This trading activity resulted in an open interest of 2803 calls. At a price between $10-11 a pop, this means someone (or some people) was willing to bet about $1M on significant price appreciation in GS in a little over a year from now. That kind of commitment always gets my attention, so I gave the long case yet another look.
While the action in the $110 calls was eye-catching, the open interest on several other higher strikes is similar or higher. Even the $340 strike has an open interest of 3916 calls! I would put the likelihood of a $340 price by January, 2010 near zero. Indeed, these options are trading for under 10 cents. So, open interest alone is not sufficient to make a bullish case.
I next took a look at the put/call ratio. Schaeffer's put/call ratio on GS shows the ratio remains at its lowest levels in a year. This suggests a high level of complacency and/or lack of fear. Notably, the ratio spiked right before Goldman's nasty spill in September, and the ratio has been declining ever since along with the sharp decline in Goldman's price. For some comparable contrast, note that the put/call ratio on the XLF is about in the middle of its one-year range. (Visit Schaeffer's site for the charts).
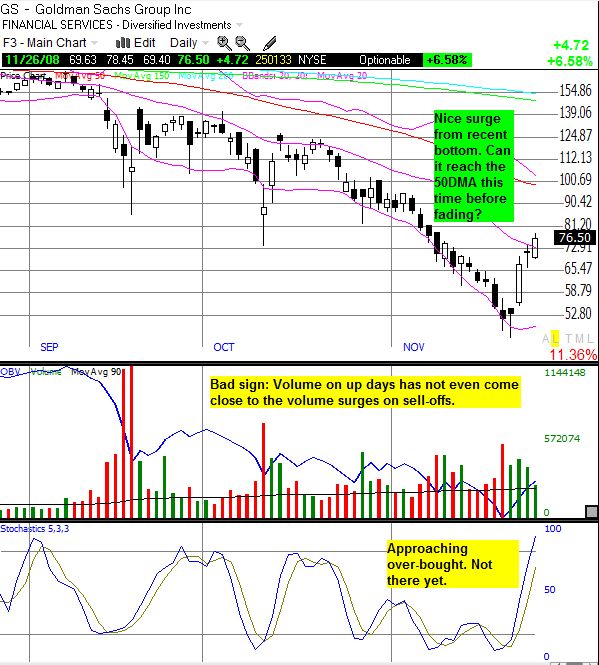
So, the overall options story gave me little reason to switch to the bullish campe. I prefer to see selective clustering of open interest for the calls and a much higher put/call ratio overall. Instead of going long, I decided to take the opposite bet and go (net) short GS as a partial hedge against other long positions. If the bear market rally fails suddenly and sharply, I expect GS will take an outsized hit. Regardless, there remains considerable short-term risk to GS shares even without a general sell-off in the markets. The chart below shows the current technical picture for GS.


So, what about the Jan 2010 calls with a strike at $105 that occupied the center of my last piece on GS? Well, those calls have increased about 63% while my recommended position in the $100/105 call spread has increased about 42%. These returns compare quite favorably to the 24% gain in GS shares in that time (measured from close of November 18, 2008). Of course, if you want to bet on the short-term appreciation in GS shares, you would not buy LEAPs and would instead choose earlier expirations.
Be careful out there!
Full disclosure: (Net) short GS. For other disclaimers click here.
Share