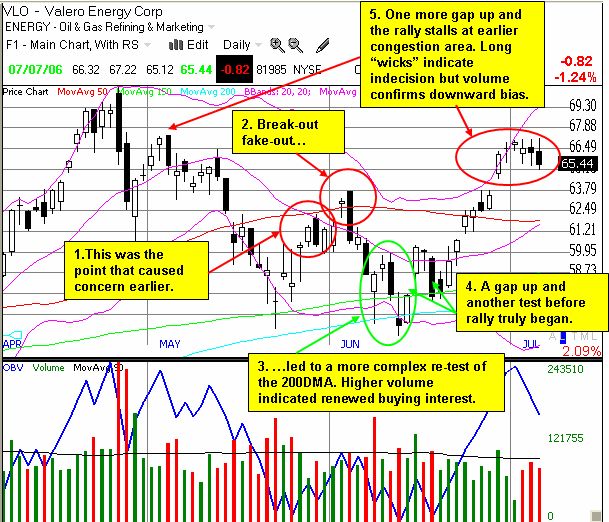
At the end of May, I used the alarm bells ringing on the price chart of Valero (VLO) as another indicator that the current bull market is slowly but surely running out of steam. Since then, VLO made another test of its 200 DMA, just as I had stated was the most likely next move. It was not a straightforward test: VLO first made one more attempt to break the 50DMA before suffering an even more serious failure. But the re-test of the 200DMA was successful. Even more interesting was that VLO went on to trade with much better volume on its way to breaking the former resistance at the 50DMA, the June high, and is now trying to re-test the 52-week and all-time highs. But aye, there be the rub! The trading in the past week was very choppy and is flashing warning signals again. The bears and bulls are duking it out right where we know to expect supply to overwhelm demand - see the "congestion" area in April and early May. VLO will probably need to fall and re-test support (currently the converging 50DMA and the middle Bollinger Band aka the 20DMA) before gathering enough steam to fight through this latest area of resistance.
Given that I wrote earlier flagging the odd divergence between oil prices and oil-related stocks, I thought it would be particularly timely do another review of VLO now. The long-term picture has not changed much, so I will focus on the short-term here (Note: I no longer hold a position in VLO. See disclaimer here.

In the meantime, be careful out there...and preserve that capital!