
(T2108 measures the percentage of stocks trading above their respective 40-day moving averages [DMAs]. It helps to identify extremes in market sentiment that are likely to reverse. To learn more about it, see my T2108 Resource Page. You can follow real-time T2108 commentary on twitter using the #T2108 hashtag. T2108-related trades and other trades are occasionally posted on twitter using the #120trade hashtag. T2107 measures the percentage of stocks trading above their respective 200DMAs)
T2108 Status: 17.1% (1st oversold close after 3 straight days dipping to or below oversold)
T2107 Status: 12.7%
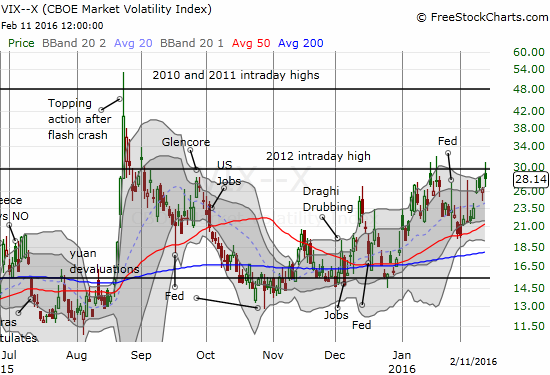
VIX Status: 28.1 (overhead resistance held yet again)
General (Short-term) Trading Call: bullish
Active T2108 periods: Day #1 under 20% (oversold day #1), Day #28 under 30%, Day #44 under 40%, Day #48 below 50%, Day #63 under 60%, Day #404 under 70%
Commentary
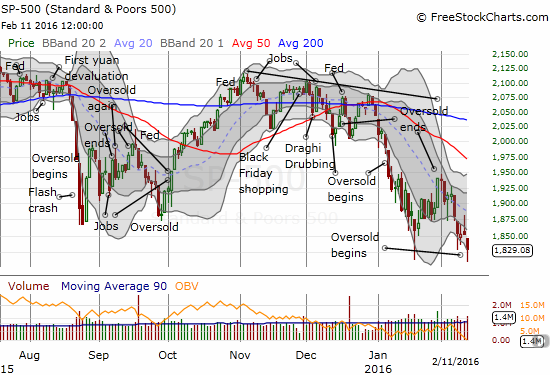
I am not surprised that yet another oversold period has arrived; T2108, the percentage of stocks trading below their respective 40-day moving averages (DMAs) dropped to 17.1%. I AM surprised (and disappointed) that the S&P 500 (SPY) never even made it close to overhead 50DMA resistance as I had expected would happen before the next oversold period. The trading action resembles more and more a bear market as sellers persistently overwhelm buyers and crowd out rally attempts. The frequency of oversold periods continue pulling the trading action downward.
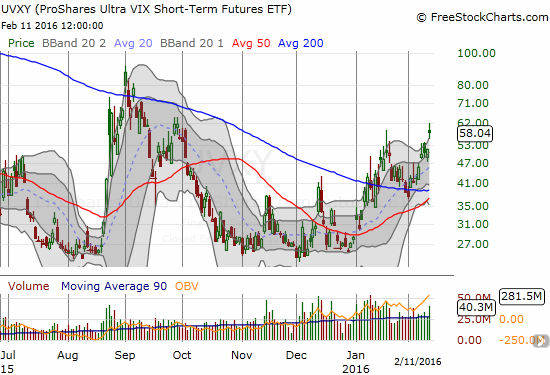
Once again the volatility index was somehow unable to close with a break of upper resistance from the intraday high in 2012. I would normally consider these failures indicative of underlying bullishness. However sellers have so far been too effective at squashing rally attempts on the S&P 500. Moreover, ProShares Ultra VIX Short-Term Futures (UVXY) still managed to print its highest close since October. As a result, the pre-Fed, anti-volatility trade failed miserably this time around.
U.S. Federal Reserve Chair Janet Yellen did not provide the market with the typical assurances that help drive volatility down. Instead, she mused about the possibilities of negative interest rates, insisted the Fed is still ready to hike rates this year, and did not yield to the market’s clear expectations that rate hikes are completely off the table for 2016. Still, I decided to reload one more time on UVXY put options and added to shares on ProShares Short VIX Short-Term Futures (SVXY) given the start of oversold trading conditions. I am waiting on the next round of call options on ProShares Ultra S&P500 (SSO).
This oversold period is now the third occurrence in just two months and the seventh in just 6 months. The gravitational pull on the market is quite clear. I have chronicled the accompanying technical deterioration in the market along the way so much it is a wonder I am not an incurable bear at this point! I have chosen to focus on the buying opportunities presented by the oversold periods because I have a well-defined model for doing so. I have since learned that my model has a huge gap in dealing with an on-going overall deterioration in the market. I have tried to compensate by initiating bearish (hedging) positions all the way to the edge of the oversold period and holding onto bearish positions for longer periods of time through the oversold period. However, as the market’s condition worsens, these adjustments are proving insufficient to cover the downside of bullish positions.
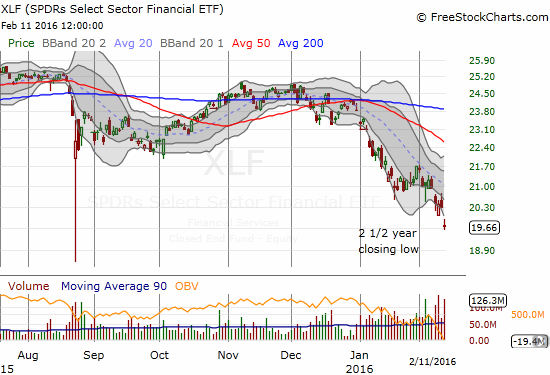
I have recently dialed up the aggressiveness of the bearish positions as another adjustment. My first success came on my favorite hedge against bullishness, Caterpillar (CAT). I closed out two fistfuls of put options on today’s gap down. As I indicated in my last T2108 Update, I have finally hopped on the downtrend in financials. I am still holding onto my two fists full of XLF put options.
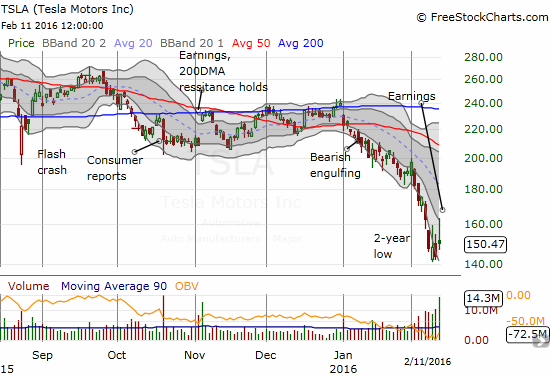
I also held onto put options on Netflix (NFLX) that became profitable. I am sticking with a large put position against BHP Billiton Limited (BHP) that I now like even more after Rio Tinto (RIO) slashed its dividend. I even initiated a new set of put options on Tesla Motors (TSLA) as a fade on post-earnings buying. True to the spirit of the market’s technical deterioration, TSLA faded hard from its intraday highs. If it behaves like so many other trading favorites in post-earnings action, sellers will soon resume their domination.
In contrast to these bearish positions, I held onto my bullish trade of the week too long: Google (GOOG). My position went into the green twice but still I held on for more convinced more follow-through would be forthcoming. GOOG now looks ready for a retest of 200DMA support.

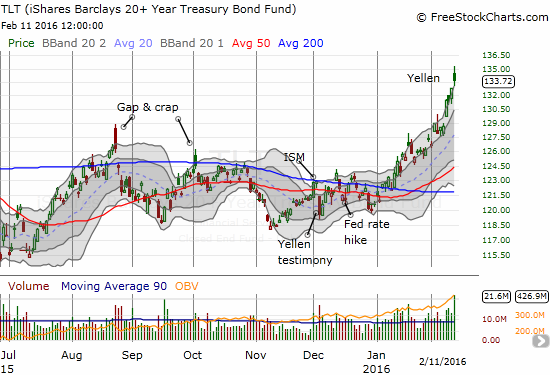
Market sentiment has soured so much that the iShares 20+ Year Treasury Bond (TLT) has gained 10.9% year-to-date. The buying of government bonds has been near relentless and runs in stark contrast to the Fed’s effort to “normalize” interest rates. The year-to-date trend shown in the below chart is definitively guided by the upper-Bollinger Bands (BBs).
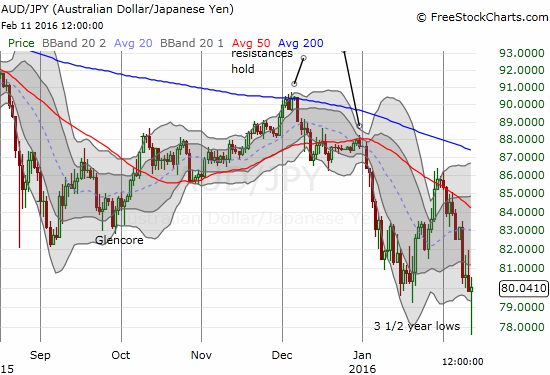
In currency markets, my favorite sentiment indicator remains the Australian dollar (FXA) versus the Japanese yen (FXY) or AUD/JPY. Overnight Wednesday and into Thursday morning, the Japanese yen strengthened significantly and the Australian dollar weakened as fears reached a fever pitch. AUD/JPY sharply recovered just ahead of the U.S. trading session and somehow managed to hold its ground from there.
Going forward, I am assuming this latest oversold period will last around 10 days as the “debt” owed from the last oversold period. If T2108 falls into single digits again, all bets are off, and I will need to figure out a new estimate. If this oversold period acts more like a typical oversold period by lasting just one or two days, then I will look forward to additional oversold periods in coming weeks.
— – —
For readers interested in reviewing my trading rules for T2108, please see my post in the wake of the August Angst, “How To Profit From An EPIC Oversold Period“, and/or review my T2108 Resource Page.
Reference Charts (click for view of last 6 months from Stockcharts.com):
S&P 500 or SPY
U.S. Dollar Index (U.S. dollar)
EEM (iShares MSCI Emerging Markets)
VIX (volatility index)
VXX (iPath S&P 500 VIX Short-Term Futures ETN)
EWG (iShares MSCI Germany Index Fund)
CAT (Caterpillar).
IBB (iShares Nasdaq Biotechnology).
Daily T2108 vs the S&P 500
")
Black line: T2108 (measured on the right); Green line: S&P 500 (for comparative purposes)
Red line: T2108 Overbought (70%); Blue line: T2108 Oversold (20%)
Weekly T2108

*All charts created using freestockcharts.com unless otherwise stated
The charts above are the my LATEST updates independent of the date of this given T2108 post. For my latest T2108 post click here.
Related links:
The T2108 Resource Page
Expanded daily chart of T2108 versus the S&P 500
Expanded weekly chart of T2108
Be careful out there!
Full disclosure: long SSO call options, long SSO shares, long SVXY shares, long UVXY puts, long TLT, long TSLA puts, long GOOG call options