Over the past year or so, I have worked to further refine the application of T2108, the percentage of stocks trading above their 40-day moving averages (DMAs), to short-term trading. Last November, I updated my analysis of overbought periods, periods where T2108 equals 70% or more. That analysis provides a complete framework for understanding the odds of duration and returns during overbought periods. In this post, I am filling in a large gap by analyzing what happens BETWEEN overbought periods. Understanding these dynamics helps a trader determine the appropriate amount of risk to take on during overbought periods.
Here are the fundamental conclusions I generated from analyzing the S&P 500’s behavior between overbought periods since 1986. For convenience, I will call this the “interim period.”
- Extended rallies are typically characterized by a series of overbought periods.
- There is no relationship between the duration of the overbought period and the maximum decline before the next overbought period. However, the largest declines have all occurred after overbought periods that lasted 20 days or less. After longer overbought periods, the maximum decline during the interim period has been 10%.
- There is also little relationship between the length of the interim period and the maximum decline during that time. However, declines of 10% or greater have ALL occurred when the interim period lasted between 50 and 155 days.
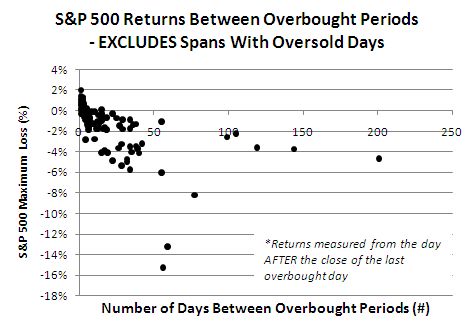
- After excluding interim periods that included oversold periods, there is a stronger relationship between the duration of the interim period and the maximum decline. The vast majority of interim periods have lasted less than 50 days.
Given these observations, traders should treat rules for trading between overbought periods as general guidelines. The risks are worth the rewards IF traders size positions modestly, prepare to make multiple trades, take at least some profits after moderate declines, AND stop out by the time T2108 has begun a new overbought period.
Specifically, traders should follow these guidelines:
- Short early but in moderate size once an overbought period begins.
- Never build a “full” trading position just in case the overbought period lasts longer than 20 days, and/or reduce the size of the bearish position after 20 days. Hedging against the bearish position counts as a reduction in risk.
- Start taking profits no later than a decline of 5% or so on the S&P 500 during the interim period. Stop out by the time the next overbought period begins.
Here are the specific charts supporting my conclusions along with some more detailed observations. (Click on the smaller charts to see the larger view).
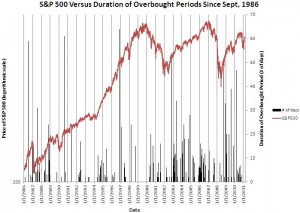
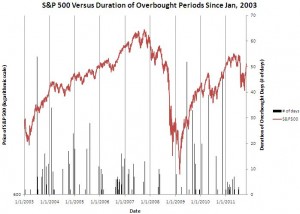
First, here is an overlay of the S&P 500 with the duration of all overbought periods since 1986. Since the chart is difficult to read, I also zoom in on the period since 2003. (Graphing difficulties in Excel prevented me from properly labeling price levels for the S&P 500 given it is on a log scale). Visually note the lack of any clear relationships between the S&P 500 and the duration of the overbought periods EXCEPT that extended rallies tend to include a multitude of overbought periods. So, if a trader finds himself constantly fading the market, it is probably time to take a step back and accept that a major rally may be underway and to plan accordingly!


The chart below is a scatter plot showing the maximum decline in the S&P 500 in the interim period indexed by the duration of the preceding overbought period. In other words, this is an attempt to answer the following question: “what is the maximum correction a trader might expect after an overbought period ends?” Returns are measured from the close of the day the overbought period ends.

First, notice that there is no correlation between the duration of the overbought period and the maximum decline in the interim period. Also notice that in SOME cases, the maximum “decline” is actually a gain. I confirmed these cases manually and found that when the duration between overbought periods lasts only a few days, the S&P 500 sometimes drifts, sometimes lower, sometimes higher, while consolidating before the next move. During uptrends or sideways action, the interim period can easily generate marginally positive returns.
Although the above chart does not generate any overall correlation, I can characterize three distinct areas of the chart (I have changed these definitions from the last time I referenced this chart):
- Area 1: most of the data cluster in the upper-left corner: most overbought periods last less than 20 days and sell-offs in the interim period are usually no greater than 10%. The clustering is particularly thick at 5 days or less. The implication for traders is the need to act early once an overbought period begins in order to realize potentially sudden and sharp sell-offs; otherwise wait for the next overbought period or enter a trade by day #10 or so. Recall that the average length of an overbought period is 9 days and the median is 4 days.
- Area 2: After an overbought period lasts at least 20 days, the maximum decline in the interim period is 10%. It seems just as likely for the maximum decline to be 0% as it is to be 7 or 8%. Thus, it is very difficult to short extended overbought periods, and not just because it starts to feel like they will never end. A trader should never allow a bearish position to remain large after 20 days and/or use the lessons from the analysis of overbought periods to wait until the S&P 500 has gained 10% or so before scaling up to a maximum size.
- Area 3: All the major corrections followed overbought periods lasting less than 20 days. The worst sell-offs clustered around the average duration of 9 days.
The general trading rule implied by these data: short early but in moderate size once an overbought period begins. Always save powder in case the overbought period lasts longer than 20 days and/or reduce the size of the bearish position after 20 days. Hedging against the bearish position counts as a reduction in the size of the bearish position.
Next, I looked at the maximum decline based on the duration of the interim period. Here again, there was little overall correlation. However, ALL the big declines occurred only after the interim period lasted at least 50 days and no more than 155 days. Since a trader will never know how long this period will last, it makes sense to set a target around -5% for at least starting to take some profits. After 50 days, a trader may actually consider increasing the size of the bearish position. However, the standard caution regarding oversold periods still apply: start closing bearish positions once T2108 drops to 20% or less.

The relationship between maximum decline and the duration of the interim period becomes clearer after removing oversold periods. In other words, if an oversold period occurs during an interim period, I remove the given interim period from the dataset.

With oversold periods removed, it is clear that the largest declines happen during oversold periods. No surprise there since sell-offs bring T2108 toward the 20% threshold. This chart also makes it even clearer that a trade should start taking profits at least by the time the S&P 500 has lost 5% during the interim period.
Overall, this analysis tells traders not to expect dramatic results from shorting overbought periods, BUT the potential for large gains does exist. Traders interested only interested in implementing BULLISH positions can rest assured they have time to wait for better prices. Assuming the market is in some kind of an uptrend, bullish traders can wait for small pullbacks AFTER the overbought period ends to greatly reduce the risk of long positions.
I have one closing note on volatility. I tried but failed to include volatility as another explanatory variable for timing short-term trades. Unlike oversold periods, volatility does not seem to generate a distinct signature during overbought periods. My assumption is that because uptrends last a lot longer than downtrends, changes in volatility during overbought periods tend to remain within the noise of volatility change or trend. Regardless, I think the story shown above is sufficient to generate actionable trading rules without further complicating matters with another explanatory variable. I will however continue to think about what ways or methods could further enhance the analysis of overbought periods.
For more information on T2108 and my various analyses of this powerful indicator, see my T2108 Resource Page.
Be careful out there!
Full disclosure: long SDS, VXX shares and puts

Dr. Duru,
I ppreciate your work much but with this latest oversold period I am beginning to question it’s usefulness for me, mostly I believe because it plays to my weakness – great fear of losing money. Because of that I have sat here for the last 28 days or so very uninvested. The chase: have you compared 2108 to the effectiveness of using RSIwilder or the two in combo?
While my propensities include a disdain for buy and hold, I have been developing an appreciation for tempering 2108 with the RSIwilder indications. For example, loooking back to only 03, the monthly RSI would have gotten one to avoid the 08/09 debacle, and except for that 08/09 period, the monthly RSI would have been a buy and hold since 03 which roughly would have netted one about 90% twice. The weekly is difficult with only two 70. But more to my initial theme, the daily RSI would have kept one highly invested since the August 2011 lows whereas 2108 has been above 70 twice since then and below 30 only once.
This is really good deep review & analysis, thanks.
In addition to T2108 some of the other Worden breadth indicators look pretty interesting:
* T2107: This is testing resistance on a long-term trend-line.
* T2109: This could be touching a long-term trend-line soon.
* T2110: This is collapsing.
* T2111: This has been bouncing off of a long-term trend-line resistance-line for a while now.
* T2112: This has already collapsed
Keep up the good work.
Tristan – you should be very interested in my last commentary on T2107: http://drduru.com/onetwentytwo/2012/02/17/t2108-update-120216/. I do not actively follow the other Worden indicators, but I will take a look now. Thanks for the reminder and the kudos!
Jospeh – I understand your questioning. It is difficult to keep historical context and appreciate the odds when what matters NOW is the current case. I have not looked at combining RSI, but, as you know, I like to keep things simple. There are many ways to skin the cat here, so if you find it useful as a complimentary indicator, I say go for it. In the meantime, the odds says that there is likely a little more upside before the overbought period ends. For traders/investors who prefer to go long, overbought periods are NOT the exact time to initiate positions. It almost always pays to wait for the next pullback to put the risk/reward back in your favor.
With the $VIX in a low non-threatening position – we find the massive $SDS limping through a small trading range – pretty consistent – enough to scalp with several thousand shares.
The Ultra 2X (2 for one) as you know looses it’s multiple as the shares react to the Host (in a choppy setting) – $SPY.
This dissolution is enhanced by a succession of days where the stock waivers back and forth, up and down. It’s possible that as the Host goes down, for example, 10% and one expects the deravitive $SDS (to increase by 20%) only increases 12+% for a period extending beyond more than several days.. and could even be worse. So, in “Full Disclosure” what are you doing between and betwixt to “reset” the dissolution back to 2 for 1. I am in and out daily at the perceived range and reset when I can – hours, days, etc. Yes, I may miss the “big move” one way and be happy to miss it the other way…. am I talking in circles?
I never even considered that during a sharp move downward, the ratio of the inverse ETF to the “host” could get so significantly skewed. That is a serious defect that I don’t thin I would want to trade more frequently to accommodate. The “next best thing” would be to just short SPY directly, right? Or, perhaps better yet, short SSO.