Speculating On Innovation ETFs Versus Big Cap Tech: ARKK vs IPO vs QQQ

speculate (Credit: Booby Stare-Down by Scott Ableman on Flickr)

This year has been a surprisingly good year for speculating. The race to the end of 2023 looked like it priced in a lot of good news, but the good news (in price action) continues apace year-to-date. Thus, I decided to take a fresh look at last year’s claim: “Renaissance IPO ETF A Less Volatile … Read more

Renaissance IPO ETF A Less Volatile Way to Speculate Than ARKK

speculate (Credit: Booby Stare-Down by Scott Ableman on Flickr)

Almost a year ago, I claimed that investing in ARK Innovation ETF (ARKK) was little different than speculating on initial public offerings in the Renaissance IPO ETF (IPO). I was both right and wrong. On the way down, IPO far out-performed ARKK in 2021 and 2022. However, ARKK has benefited more than IPO in this … Read more

Market Breadth Last Did This 17 Months Ago

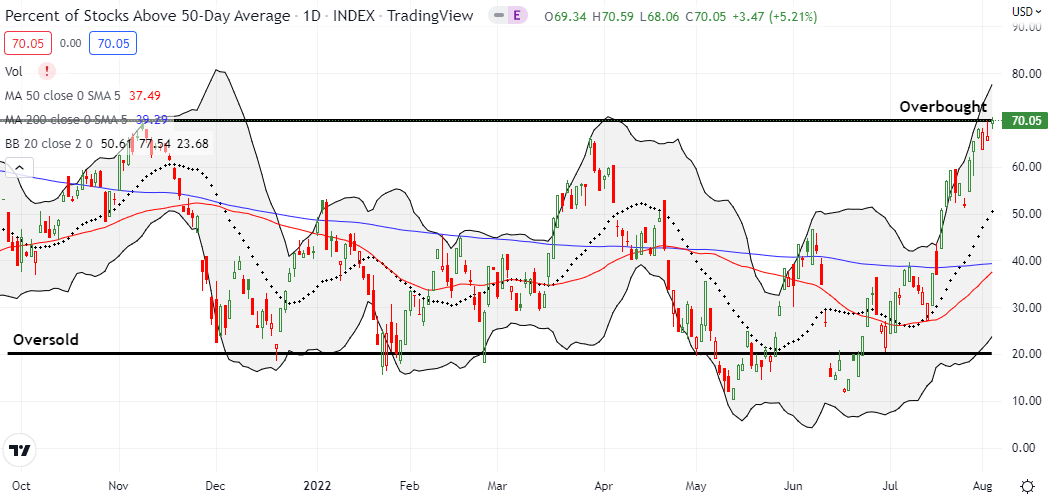
AT50 (MMFI) closed right on top of the overbought threshold. You just can't make this stuff up. Market breadth was last at these levels 17 months ago.

Stock Market Commentary: Market breadth was last this high 17 months ago. At that time, my favorite technical indicator was on its way down as a part of another buy-the-dip moment for the pandemic-inspired rally in the stock market. This time, market breadth is sitting right on top of the threshold of overbought conditions. The … Read more

Stock Chart Reviews – Snapshots of a Looming Global Wartime Economy

Stock Market Commentary Russia’s invasion of Ukraine has created massive human misery and a historic press of global economic sanctions. With war comes scarcity and the allocation of resources to destroying the resources of others. Financial markets are scrambling to adjust to the new global wartime economy. These charts are just a snapshot of some … Read more

T2108 Update (July 7, 2014) – Overbought Conditions End As Momentum Recovery Loses Fuel

(T2108 measures the percentage of stocks trading above their respective 40-day moving averages [DMAs]. It helps to identify extremes in market sentiment that are likely to reverse. To learn more about it, see my T2108 Resource Page. You can follow real-time T2108 commentary on twitter using the #T2108 hashtag. T2108-related trades and other trades are … Read more

T2108 Update (June 17, 2014) – A Market Bursting At the Seams Ahead of Fed (Includes Chart Reviews)

(T2108 measures the percentage of stocks trading above their respective 40-day moving averages [DMAs]. It helps to identify extremes in market sentiment that are likely to reverse. To learn more about it, see my T2108 Resource Page. You can follow real-time T2108 commentary on twitter using the #T2108 hashtag. T2108-related trades and other trades are … Read more

T2108 Update (April 14, 2014) – A Timid Bounce From Oversold Conditions

(T2108 measures the percentage of stocks trading above their respective 40-day moving averages [DMAs]. It helps to identify extremes in market sentiment that are likely to reverse. To learn more about it, see my T2108 Resource Page. You can follow real-time T2108 commentary on twitter using the #T2108 hashtag. T2108-related trades and other trades are … Read more