Stocks Wind Back Up – Above the 40 (July 31, 2020)

Stock Market Statistics AT40 = 51.5% of stocks are trading above their respective 40-day moving averages (DMAs) AT200 = 35.6% of stocks are trading above their respective 200DMAs VIX = 24.5Short-term Trading Call: neutral Stock Market Commentary Major League Baseball (MLB) may be forced to wind back down, but stocks look like they are winding … Read more

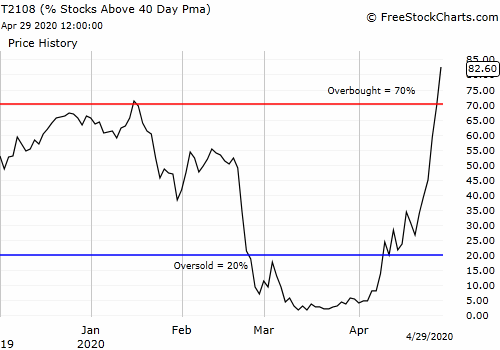
Stock Market Launches Deeply Into Overbought Trading Conditions – Above the 40 (April 29, 2020)

AT40 (T2108) soared to 82.6% and started overbought conditions at extreme levels.

Stock Market Statistics AT40 = 82.6% of stocks are trading above their respective 40-day moving averages (DMAs) (first oversold day)AT200 = 17.7% of stocks are trading above their respective 200DMAsVIX = 31.2Short-term Trading Call: neutral Stock Market Commentary On Tuesday, AT40 (T2108), the percentage of stocks trading above their respective 40-day moving averages (DMAs), rallied … Read more

T2108 Update (January 27, 2014) – Market Stretches Further Into Quasi-Oversold Conditions

(T2108 measures the percentage of stocks trading above their respective 40-day moving averages [DMAs]. It helps to identify extremes in market sentiment that are likely to reverse. To learn more about it, see my T2108 Resource Page. You can follow real-time T2108 commentary on twitter using the #T2108 hashtag. T2108-related trades and other trades are … Read more

T2108 Update (January 23, 2014) -Overbought for One Day…And All Aussie-Yen Breaks Loose

(T2108 measures the percentage of stocks trading above their respective 40-day moving averages [DMAs]. It helps to identify extremes in market sentiment that are likely to reverse. To learn more about it, see my T2108 Resource Page. You can follow real-time T2108 commentary on twitter using the #T2108 hashtag. T2108-related trades and other trades are … Read more

T2108 Update (July 12, 2013) – New All-Time Highs With Room to Run

(T2108 measures the percentage of stocks trading above their respective 40-day moving averages [DMAs]. It helps to identify extremes in market sentiment that are highly likely to reverse. To learn more about it, see my T2108 Resource Page. You can follow real-time T2108 commentary on twitter using the #T2108 hashtag. T2108-related trades and other trades … Read more

T2108 Update (April 4, 2013) – First Lessons from the First Application of the New T2108 Model

(T2108 measures the percentage of stocks trading above their respective 40-day moving averages [DMAs]. It helps to identify extremes in market sentiment that are highly likely to reverse. To learn more about it, see my T2108 Resource Page. You can follow real-time T2108 commentary on twitter using the #T2108 hashtag. T2108-related trades and other trades … Read more

F5 Networks Should Soon Recover Recent Post-Earnings Losses

(This is an excerpt from an article I originally published on Seeking Alpha on August 5, 2012. Click here to read the entire piece.) On July 20th, I described the mechanics of making the pre-earnings trade on F5 Networks (FFIV) (see “Lessons From The F5 Networks Earnings Trade“). After finishing the post-earnings trade with a … Read more

Chart Review: From Promise to Letdown – Finisar, JDSU, F5 Networks

A week ago I used F5 Networks (FFIV) as a model to suggest that Finisar (FNSR) and JDS Uniphase (JDSU) showed some promise to bounce from critical support levels. I drew out the specific price points at which buys made sense and included some stops. The promise quickly led to a letdown as both FNSR … Read more

Chart Review: Finisar, JDSU Could Be Ready for Bounces, F5 Networks

Finisar (FNSR) was punished with a 39% one-day loss last week after announcing disappointing guidance for the current quarter that included the extremely poisonous phrase “…a slowdown in business in China.” The tremendous price drop combined with record trading volume of 40.4M shares displayed all the classic markings of complete abandonment by institutions and large … Read more