
AT40 = 35.9% of stocks are trading above their respective 40-day moving averages (DMAs) (jumped from 25.6%)
AT200 = 43.0% of stocks are trading above their respective 200DMAs (up from 2-year closing low at 37.5%)
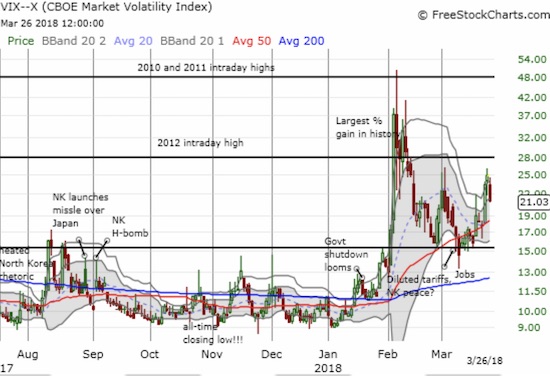
VIX = 21.0
Short-term Trading Call: neutral
Commentary
This is truly a market that is from another planet.
In my Above the 40 post for Friday, March 23rd, I went through the good, the bad, and the ugly of the stock market. I was biased toward buying into the looming oversold conditions and particularly targeted the S&P 500 (SPY) which was stretched well below its lower-Bollinger Band (BB). I bolstered my confidence with some key hedges. While I was optimistically looking forward to the index popping back up like a buoy pushed underwater, nowhere in my scenario planning did I even think about a day like this one!
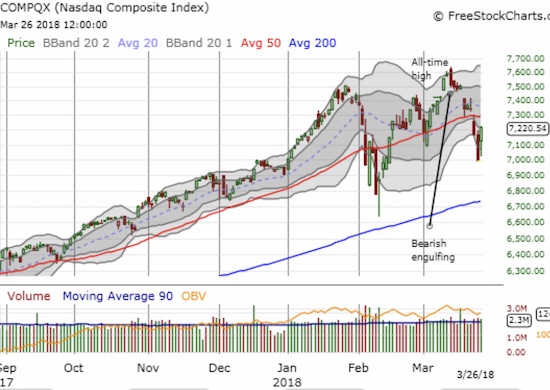
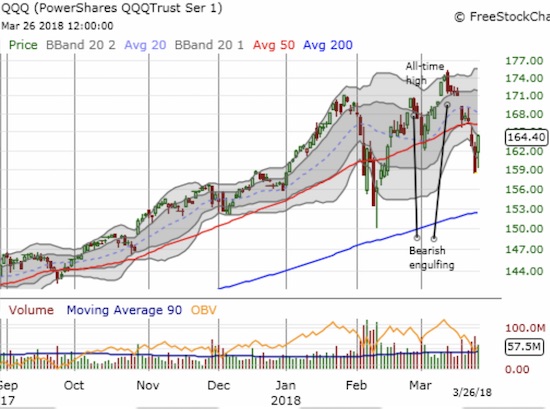
The S&P 500 (SPY) soared 2.7%. The Financial Select Sector SPDR ETF (XLF) gained 3.2%. The NASDAQ gained 3.3%. The PowerShares QQQ ETF (QQQ) popped 3.7%. The iShares Russell 2000 ETF (IWM) under-performed the crew with a 2.2% gain. Even the waning iShares US Home Construction ETF (ITB) popped 2.4%.
The 5-minute intraday chart on the S&P 500 is very instructive. The strong open only lasted 10 minutes before sellers stepped in. No doubt, this crowd was relieved to get the prices it felt it missed on Thursday and Friday. Sellers dominated the action for about 90 minutes. At that point buyers finally mounted a successful counter which took price above the previous down candle. Once the intraday downtrend broke, the buyers were off to the races.
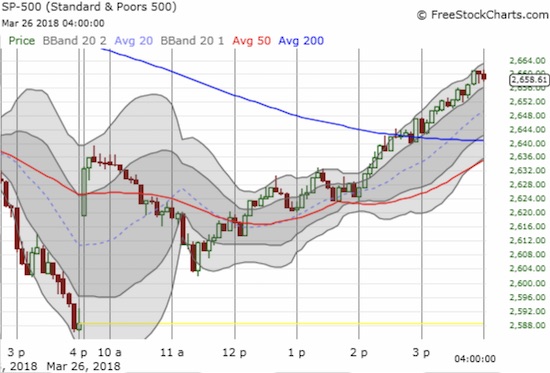
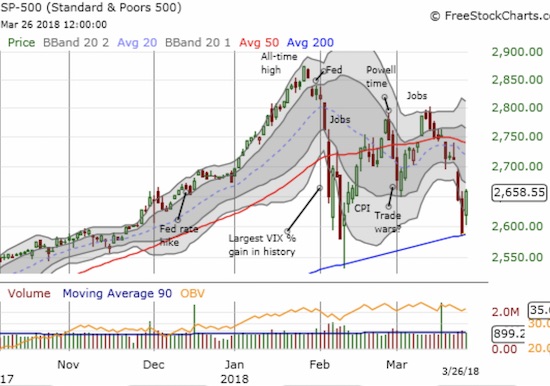
The yellow line represents Friday’s close where the S&P 500 sat on top of 200DMA support. So once it looked like buyers changed the tide, it was a VERY dangerous time to stay bearish on the market. I decided to hold onto my SPY shares and call options. Intraday, I flipped call options in the likes of QQQ and Nvidia (NVDA). I covered my short in Equifax (EFX) right at the open but held onto all my other shorts as on-going hedges. For good measure I added call options to some of those positions like Caterpillar (CAT). I held onto my short position in iPath S&P 500 VIX ST Futures ETN (VXX).
The volatility index, the VIX, dropped 15.4% and closed at 21.0. So the fear gauge remains “elevated” (above 20). In other words, do not count out the sellers just yet even as it seems buyers so well defended 200DMA support on the S&P 500.
Put it all together and AT40 (T2108), the percentage of stocks trading above their respective 40DMAs, jumped an astounding 10 percentage points from 25.6% to 35.9%. AT40 closed above Friday’s open and, given what I described in the last Above the 40 post, my favorite technical indicator likely confirmed a bullish (albeit choppy) uptrend as it continues a recovery from February’s deeply oversold conditions. AT200 (T2107), the percentage of stocks trading above their respective 200DMAs, is still in the dangerzone with a close at 43.0%.
I am still keeping the short-term trading call at neutral even though I am tempted to flip all the way to bullish with such an emphatically successful retest of 200DMA support. As I wrote in a previous post, I do not think it is useful to chase the current market churn with short-term trading calls. I will only change the call once/if AT40 hits an important extreme. AT40 did not quite get to oversold, so the neutral rating is in deference to what I think will be continued choppy trading with abrupt twists and turns. The market’s new reality is government-driven headlines undermining the market’s mood at any time. This time just happened to be positive headlines about negotiations with China that could avert a trade war. In two more days, we could be hammered with headlines about failing negotiations. The main question remains the resiliency of investors through this chaotic period.
CHART REVIEWS
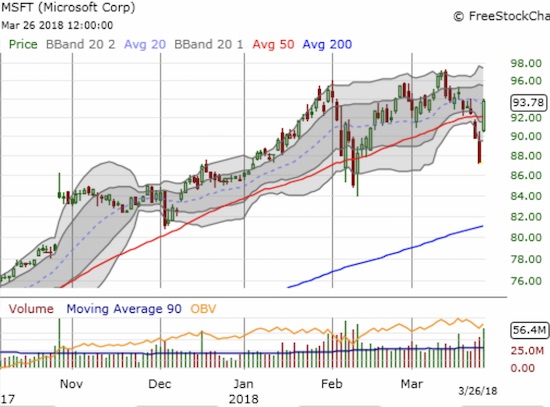
Microsoft (MSFT)
On a day of astounding moves, MSFT stood astoundingly tall. Morgan Stanley delivered a shocker $130 price target with a prediction that MSFT would be the first trillion dollar company, ahead of all the usual suspects. Unlike other tech stocks, MSFT gapped up and never looked back. MSFT sliced right through its 50DMA and looks like a prime buy-the-dip candidate. For the first time in a VERY long time, I have “Mr. Softee” on my radar.
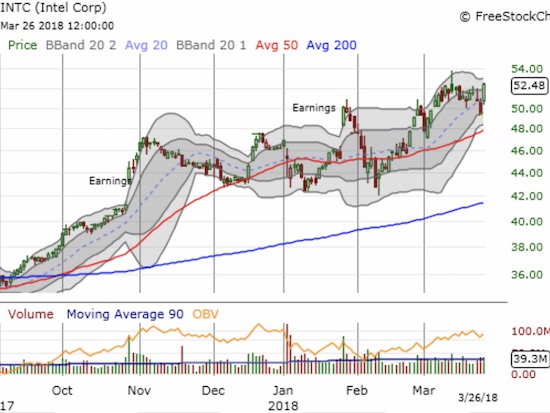
Intel (INTC)
I have been itching to get back into INTC as the the countdown to April earnings gets louder and louder. Last week’s sell-off did not do enough damage to give me the new entry point I wanted (like a 50DMA test). So I was disappointed to see it soar without me to a 6.3% gain and a fresh 17+ year closing high.
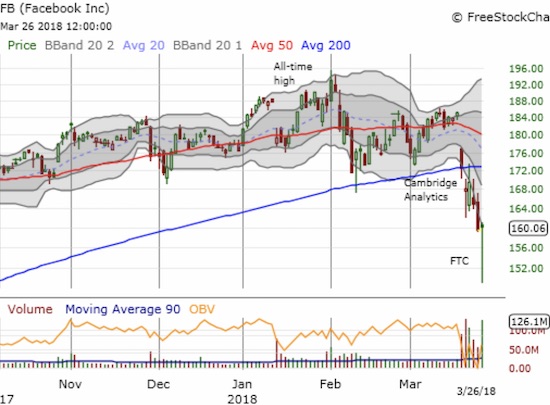
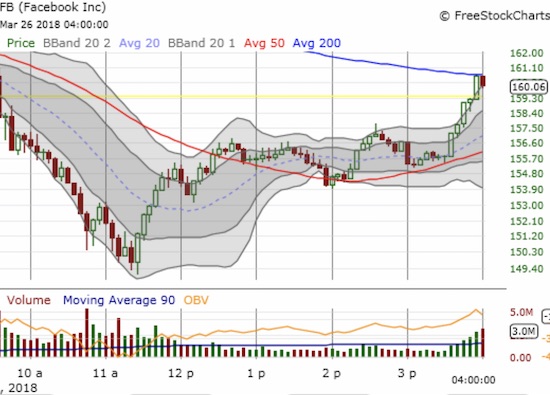
Facebook (FB)
Facebook was astounding in a very different way. News about a non-public FTC investigation sent sellers into the stock right after the open. At some point, someone must have gotten the tap on the shoulder about the entire stock market running in the other direction. FB began an incredible run-up of over 10 points off the low. This was a dramatic lesson about how panic can get a stock so over-extended it has no where to go but up. Sellers pushed the buoy way too far under the lower-Bollinger Band (BB)…
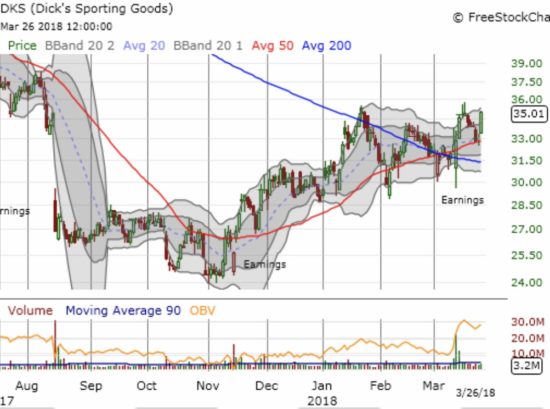
Dick’s Sporting Goods (DKS)
My position in DKS was called away so I did not get to enjoy today’s extension of profits. Still, I am gratified to see my bullish thesis continue to play out. I should have been ready to buy this near picture-perfect bounce off 50DMA support. I plan not to miss the next entry point.
Other trades related to previous posts: flipped QQQ call options, bought CAT calls
— – —
FOLLOW Dr. Duru’s commentary on financial markets via email, StockTwits, Twitter, and even Instagram!
“Above the 40” uses the percentage of stocks trading above their respective 40-day moving averages (DMAs) to assess the technical health of the stock market and to identify extremes in market sentiment that are likely to reverse. Abbreviated as AT40, Above the 40 is an alternative label for “T2108” which was created by Worden. Learn more about T2108 on my T2108 Resource Page. AT200, or T2107, measures the percentage of stocks trading above their respective 200DMAs.
Active AT40 (T2108) periods: Day #27 over 20%, Day #1 over 30% (overperiod ending 1 day under 30%), Day #3 under 40% (underperiod), Day #10 under 50%, Day #35 under 60%, Day #41 under 70%
Daily AT40 (T2108)
")
Black line: AT40 (T2108) (% measured on the right)
Red line: Overbought threshold (70%); Blue line: Oversold threshold (20%)
Weekly AT40 (T2108)

*All charts created using freestockcharts.com unless otherwise stated
The charts above are my LATEST updates independent of the date of this given AT40 post. For my latest AT40 post click here.
Related links:
The AT40 (T2108) Resource Page
You can follow real-time T2108 commentary on twitter using the #T2108 or #AT40 hashtags. T2108-related trades and other trades are occasionally posted on twitter using the #120trade hashtag.
Be careful out there!
Additional disclosure: long SPY shares and calls, long FB calls (of minimal value), short VXX
*Charting notes: FreeStockCharts.com uses midnight U.S. Eastern time as the close for currencies. Stock prices are not adjusted for dividends.