
AT40 = 27.5% of stocks are trading above their respective 40-day moving averages (DMAs)
AT200 = 48.3% of stocks are trading above their respective 200DMAs
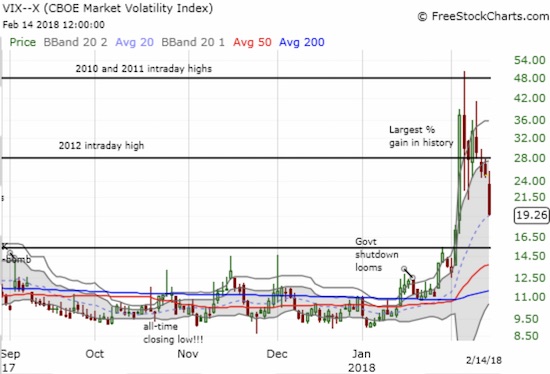
VIX = 19.3 (drop of 22.9%)
Short-term Trading Call: bullish
PROLOGUE
Valentine’s Day, February 14th, was a great day in the stock market and a fantastic validation of my strategizing during the recent oversold periods. However, I was not able to complete a victory lap out of respect for and mourning over the latest mass shooting in the U.S., this time at a Parkland, Florida high school. This blog is of course about financial markets, but I would be remiss not to acknowledge this particular tragedy. Even as the homicide rate continues a decades long decline in America, the relentless occurrence of mass shootings seems obstructs any sense of comfort from the raw statistics.
Commentary
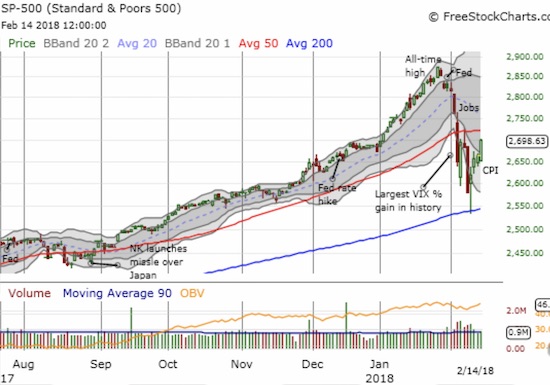
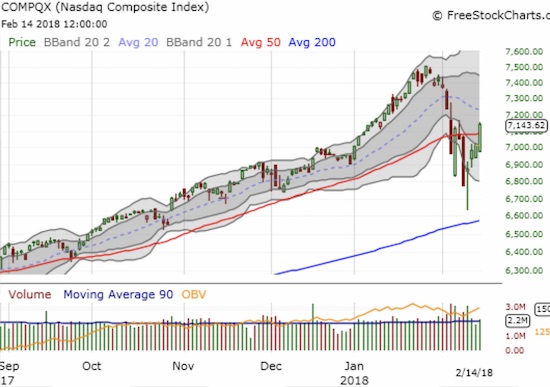
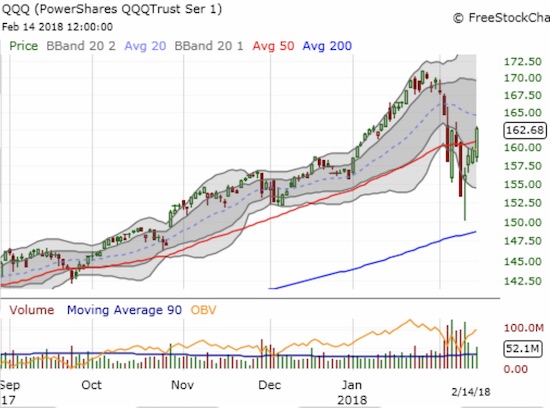
So maybe the stock market is not so scared about inflation and rising rates after all. The Consumer Price Index (CPI) report came in slightly hotter than “expected” and created an instant negative response in stock futures. The S&P 500 (SPY) gapped down in the morning and buyers stepped right in from there. Around 10am Eastern someone ignited the rocket under the market and that was all she wrote for the earlier negative sentiment. At the close, the S&P 500 (SPY) gained 1.3%, the NASDAQ gained 1.9%, and the PowerShares QQQ ETF (QQQ) gained 1.9%. Most importantly, both the NASDAQ and QQQ bullishly punched right through their respective 50-day moving averages (DMAs).
Given my bullish trading call, I used the morning’s dip to add to my call options on SPY. I decided I have sufficient hedging to protect enough of my backside in case sellers abruptly reappear to spoil the party. I was very tempted to sell my all my SPY call options at the close, but I held. I want to wait until at least a test of 50DMA resistance.
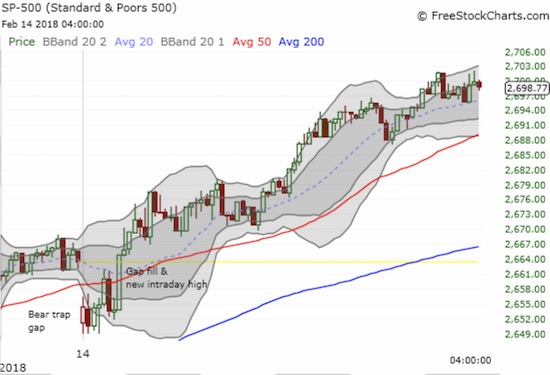
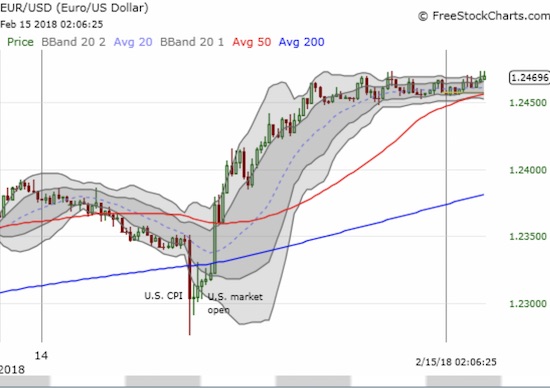
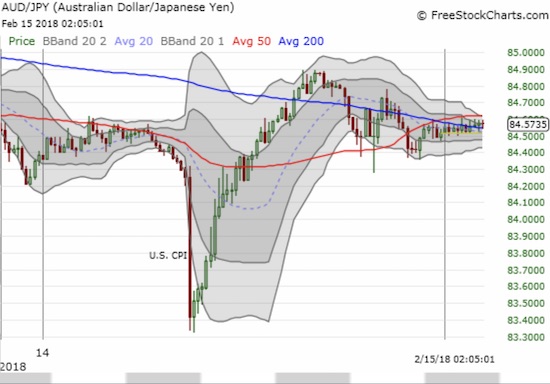
I first saw the 10am turning point in the currency markets. At that time, I assumed “something” happened, but I failed to find anything definitive (and at the time of writing I still even lack speculation). So once I saw stocks shifting into high gear, I assumed the bounce out of oversold conditions was still in full force. The change in character was in a weakened U.S. dollar and a weakened Japanese yen. I use a 15-min intraday chart to show how quickly the angst over the CPI ended: no more than 15 minutes. So by the time the market opened almost an hour later, it was probably clear to attentive traders that the gap down in stocks needed to get bought.
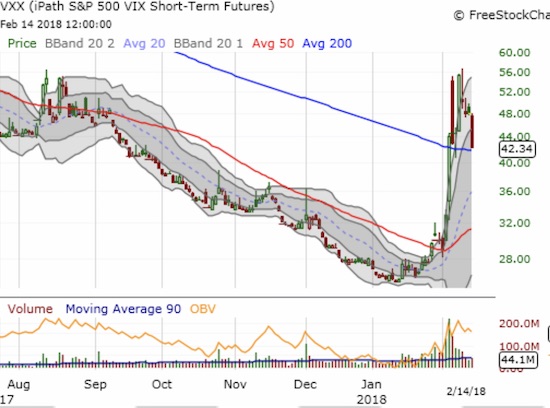
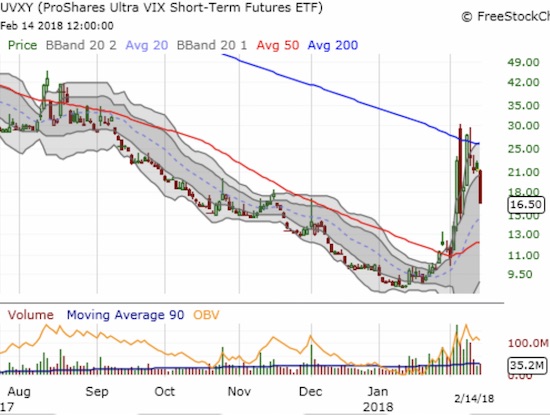
The volatility index, the VIX, left no doubt that the day was bullish. The implosion of the VIX continued as expected, and it closed with a 22.9% loss. A complete reversal of the historic day is close at hand. However, I used this opportunity to significantly scale back my volatility fades by selling my ProShares Short VIX Short-Term Futures (SVXY) call options and most of my ProShares Ultra VIX Short-Term Futures (UVXY) put options. I kept my short on iPath S&P 500 VIX ST Futures ETN (VXX).
Finally, AT40 (T2108), the percentage of stocks trading over their respective 40DMAs, surged to 27.5%, its highest close since the first oversold period. For traders following the conservative oversold trading strategy, today would be particularly gratifying as the previous day’s buys would be deep in the green.
I got a kick watching the good folks on Nightly Business Report (NBR) struggle to explain why the market seemed to react so differently to inflationary pressures than last time. I am sure they had good company. I think the simplest explanation works best: the most motivated sellers who are terrified by the inflation-related readings finally exhausted themselves with the CPI report.
The intraday trading also provided a new line in the sand. If the S&P 500 gets rejected by resistance at its 50DMA, I will be looking for a hold at today’s intraday low of 2649. The intraday chart shows sellers hit that level a series of times after the open and could not break it. So if this line breaks in the future, I will assume that sellers are back in control and ready to retest last week’s low.
CHART REVIEWS
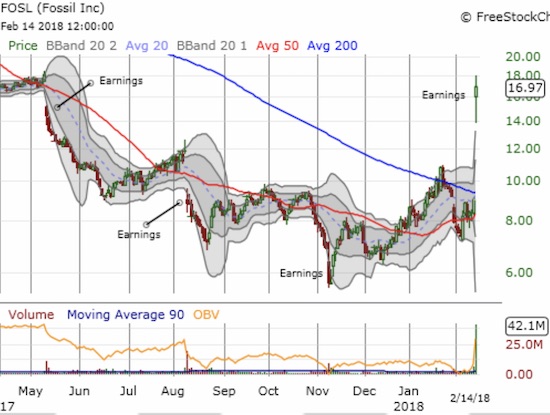
Fossil (FOSL)
FOSL was the clear star of the day. The stock is (was?) incredibly crowded with shorts to the tune of 75.2% of its float. No doubt the rush to the exits was exaggerated by this crowding. At one point, FOSL scored a double from its previous close!
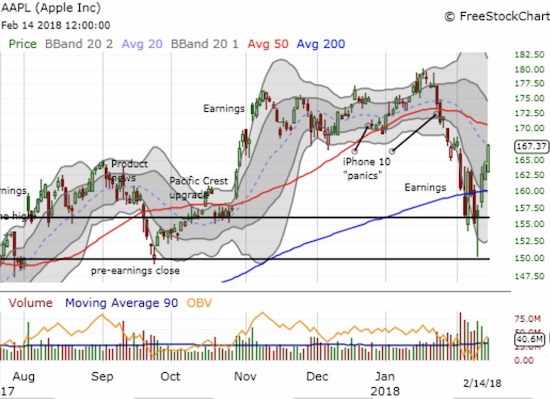
Apple (AAPL)
Much to my surprise, AAPL buyers have really put some muscle into their efforts this week. The stock is clearly no longer weighing on sentiment. The quick recovery from the 200DMA breakdown is a very bullish development for AAPL and the stock market.
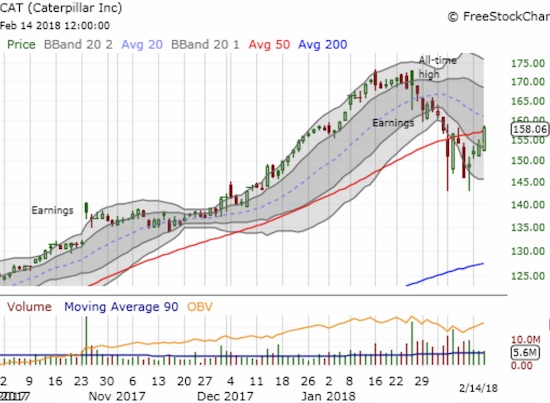
Caterpillar (CAT)
CAT just barely peeked over its 50DMA after gaining 2.7% on the day. It was a perfect spot to add one more time to my hedge against bullishness with put options.
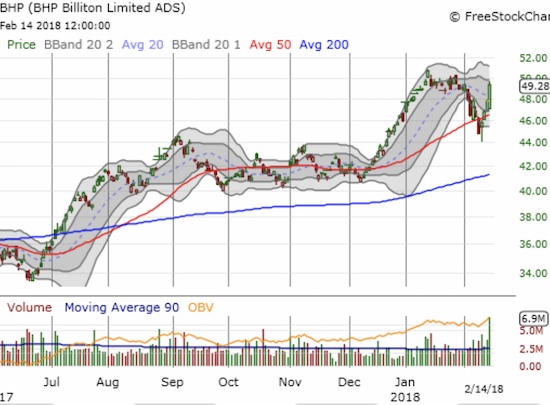
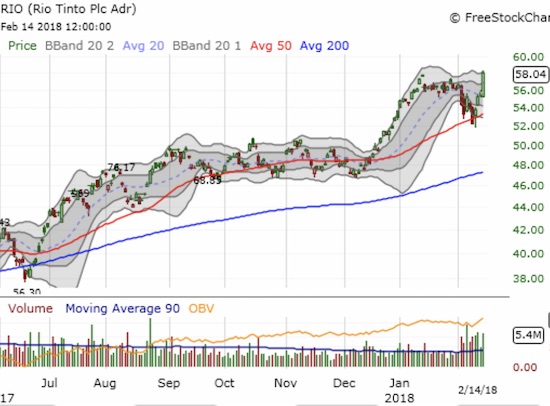
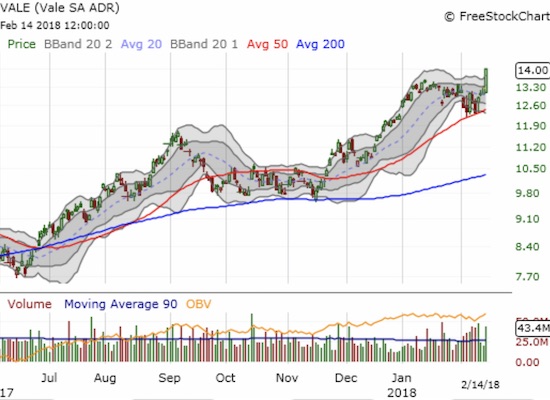
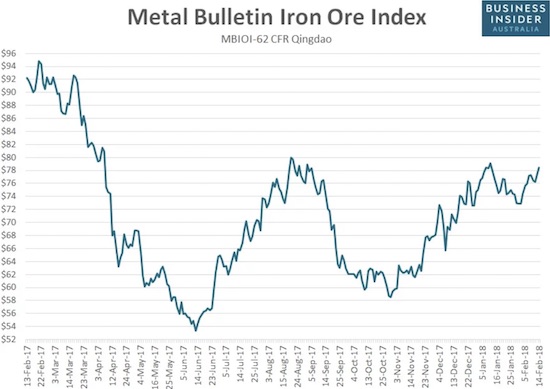
BHP Billiton (BHP), Rio Tinto (RIO), Vale (VALE)
I have successfully flipped BHP put options twice. With the stock up another 3.2%, I purchased my third tranche of put options since I posted my bearish top thesis on iron ore. However, the third time may NOT be a charm! While BHP stopped well short of its previous high, RIO gained 4.2% to hit a new 3 1/2 year high and VALE did the same. Per my trading strategy, if BHP makes a new high, I will change my positioning to a pairs trade by going long RIO with call options (even shares make sense now as well.) Note that BHP is relatively lagging the more heavily concentrated iron ore plays.
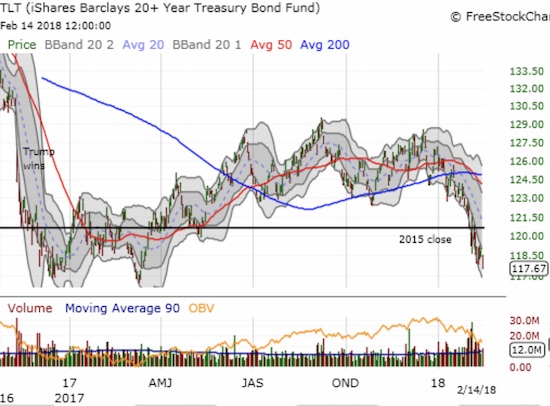
iShares 20+ Year Treasury Bond ETF (TLT)
One thing happened as expected in the wake of increased inflation pressure – long-term rates rose again. TLT closed with a 1.1% loss and an 11-month low.
Other trade notes from previous AT40 posts: bought BBY call options
— – —
FOLLOW Dr. Duru’s commentary on financial markets via email, StockTwits, Twitter, and even Instagram!
“Above the 40” uses the percentage of stocks trading above their respective 40-day moving averages (DMAs) to assess the technical health of the stock market and to identify extremes in market sentiment that are likely to reverse. Abbreviated as AT40, Above the 40 is an alternative label for “T2108” which was created by Worden. Learn more about T2108 on my T2108 Resource Page. AT200, or T2107, measures the percentage of stocks trading above their respective 200DMAs.
Active AT40 (T2108) periods: Day #2 over 20%, Day #8 under 30%, Day #9 under 40%, Day #9 under 50%, Day #10 under 60%, Day #16 under 70%
Daily AT40 (T2108)
")
Black line: AT40 (T2108) (% measured on the right)
Red line: Overbought threshold (70%); Blue line: Oversold threshold (20%)
Weekly AT40 (T2108)

*All charts created using freestockcharts.com unless otherwise stated
The charts above are my LATEST updates independent of the date of this given AT40 post. For my latest AT40 post click here.
Related links:
The AT40 (T2108) Resource Page
You can follow real-time T2108 commentary on twitter using the #T2108 or #AT40 hashtags. T2108-related trades and other trades are occasionally posted on twitter using the #120trade hashtag.
Be careful out there!
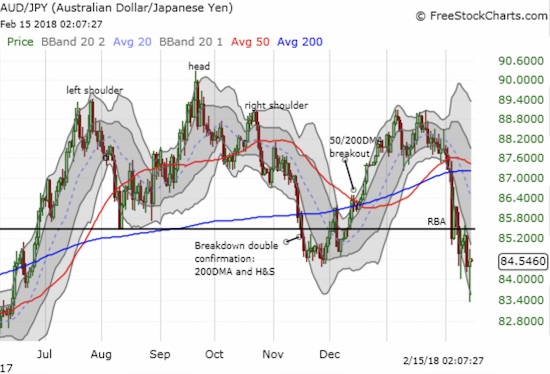
Full disclosure: long UVXY puts, short AUD/JPY, long BHP puts, long CAT calls and puts, long TLT calls, long SPY calls and calendar call spread, long BBY call options
*Charting notes: FreeStockCharts.com uses midnight U.S. Eastern time as the close for currencies. Stock prices are not adjusted for dividends.