
The volatility index, the VIX, closed below 11 on April 24, 2017. That launched 184 trading days of extremely low volatility (ELV). The VIX is now just 1 more trading day away from finally bringing this historic event to an end. By my definition, it takes 20 trading days of the VIX closing above 11 to end a period of extremely low volatility. Not only is the VIX well above 11 with its close on Friday at 29.1, but also the February run-up in the VIX included the largest percentage gain in history at 116%.
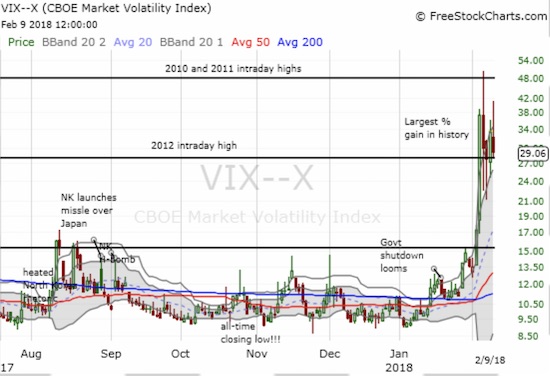
Source: FreeStockCharts.com
In 2017, I wrote a series of posts titled “The Surprising Implications of Periods of Extremely Low Volatility…” In the first two posts, I tried to use the history of periods of ELV to project the timing of a pullback of at least 5% for the S&P 500 (SPY). In the first post I observed the following:
“…note that of the 12 completed periods of extremely low volatility, only FIVE preceded pullbacks of at least 5% for the S&P 500 as measured from the last day of the period. The last three periods of extremely low volatility all preceded such pullbacks. In other words, since 1990, not only have periods of extremely low volatility been rare, but also pullbacks following such periods were NOT the norm until 2006. Whether we should expect the current period to be like the last three or more like the previous 9 is a matter of perspective…
Note that even when a pullback quickly followed the end of a period of extremely low volatility, that period lasted a very long time! IF a 5% pullback occurs, the average time for it to happen is 77 days.”
From this post, I made the counter-intuitive and surprising conclusion that periods of ELV are generally bullish. I used this small historical record to project a 5%+ pullback in May. When the S&P 500 suddenly took a dive of as much as 2% on May 17, 2017, I thought I had indeed stumbled upon a tradable relationship. Instead, the sell-off lasted just that one day. After that day the S&P 500 was off to the races again. After reviewing the trading action, I reset the clock for a 5%+ pullback in August and duly noted the confirmation of the bullish impications of periods of ELV.
August was one of the weakest months of the year. Yet, two large one-day pullbacks separated by 5 trading days were not even close to enough to delivering a 5%+ pullback. In my next review, and the third post in the series, I acknowledged that periods of ELV are so bullish that estimating the timing of the next significant pullback is not (yet?) a worthwhile exercise. I turned my attention to observing patterns in the VIX itself:
“The current period of ELV has lasted a record 151 trading days through November 24, 2017. This period includes a new all-time closing low for the VIX of 9.1 on November 3rd. Starting in June, the VIX challenged the former all-time low several times. The VIX started this week by dropping below 11 once again. This time, I am not reseting the clock. Instead, I am noting that the VIX has delivered a notable spike in volatility at least once every three months. I am also noting that record lows and record one-day spikes have comfortably (perhaps ironically?) co-existed this year. Time will tell whether conditions around the next spike in volatility will finally be bearish enough to deliver a significant pullback in the stock market.”
I wrote that in November. Three months later, THIS February, volatility sure enough spiked again almost like clockwork. THIS time, the disruption was violent enough to push the S&P 500 into a 5%+ pullback. In the wake of a record percentage gain in the VIX, the S&P 500 dropped into correction territory. On February 8th, the S&P 500 closed 10.2% off its all-time high. Assuming volatility does not completely implode on Monday, the last period of ELV will end at an amazing 184 trading days. This historic run also took the longest to deliver a 5%+ correction as measured from the first day the VIX closed below 11.
Note well that even with the depth of the current correction, this past period of ELV was STILL bullish. The S&P 500 delivered a 11.6% return from April 24, 2017 to February 5, 2018 when the S&P 500 closed with a 5%+ correction from the all-time high (7.8% to be exact). In other words, it still takes precision timing to profit from shorting a market experiencing a period of ELV.
So now what?
There are at least two narratives at work now, both supported by just small amounts of data since extremes of volatility are so uncommon (of course). The record percentage gain in volatility is alarming because the previous record was a 64.2% gain on February 27, 2007. The S&P 500 double-topped later in the year, and the financial crisis tore fear through our hearts the following year.
Next largest % gain on #VIX was February 27, 2007 at 64.2%. $SPY double-topped later that year. Financial crisis ~18 months later. =gulp=
— Dr. Duru (@DrDuru) February 5, 2018
That spike put an exclamation mark on the end of a 90-day period of ELV at that time. The volatility spike occurred two days after the end of the ELV. So it would seem that a new record percentage gain for the VIX, also occurring near an all-time high for the S&P 500, should signal a major top in the works.
YET, 2007 was the ONLY conclusion of a period of ELV which preceded a major top. The other major top we have to work with, in 2000, occurred after a sustained rise in volatility over 4 years. Ahead of the 2000 top, the VIX last closed below 11 on December 21, 1995. So if I argue for a major top, I could just as easily say it is coming in another 12 to 18 months or as much as four years from now.
In other words, we have limited experience with these extreme episodes. The more easily observed 5% pullback has happened. From here, what matters most is whether and what new equilibrium the VIX achieves. Based on the median, the VIX should settle around 17.5. You can estimate the median by adding up the percentages on either side of 18 in the VIX distribution chart below. I expanded the VIX bins from the last update now that the VIX is so high.
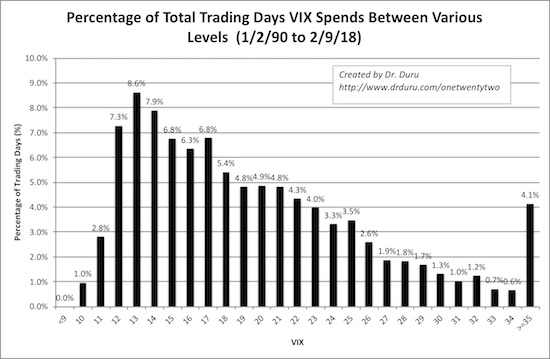
Source for data: Yahoo Finance
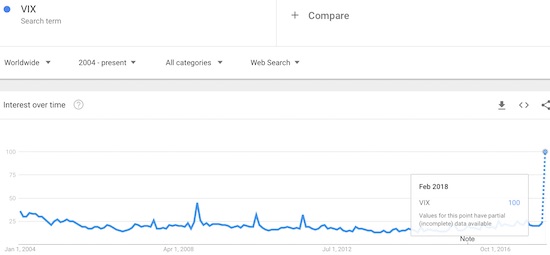
The financial media have screamed headlines about volatility for over a week, including a lot of poor descriptions of the VIX and bad explanations of what is happening. Per Google Trends, interest in the VIX has never been higher (since 2004 anyway) with a daily peak on February 6th. On that day the VIX ran up as high as 50.3 before imploding as low as 22.4; the previous day was the VIX’s record percentage gain.

Source: FreeStockCharts.com
As a reminder, my abiding theory in using Google Trends for analyzing price action is that an extreme in interest accompanied by a price extreme marks the approximate end of that price extreme. In this case, the timing is working out well again. The VIX is unlikely to surpass last week’s closing or intraday high anytime soon. Marrying the Google Trends with the my trading strategies for oversold market conditions, I feel relatively good about stepping into a fresh round of fades on the VIX on Friday. I bought put options on ProShares Ultra VIX Short-Term Futures (UVXY) and even call options on the (now much maligned) ProShares Short VIX Short-Term Futures (SVXY).
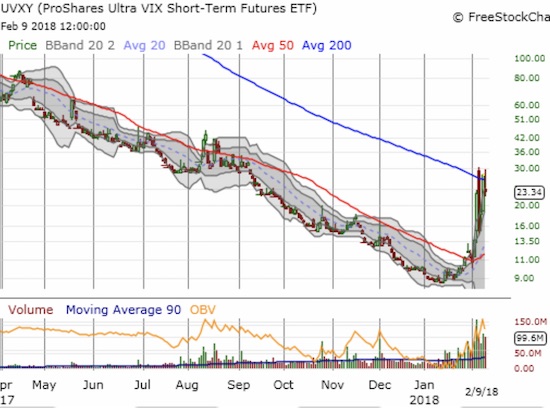
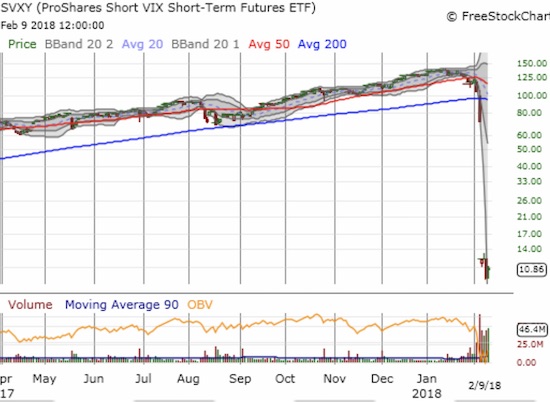
Source: FreeStockCharts.com
Unsurprisingly, traders have sent the trading volumes on volatility products to new heights. I have heard erroneous explanations that the trading in these instruments is driving volatility in the market. Sure some over-leveraged traders who suffered big losses in these instruments may be selling stocks to cover margin calls, but it is volatility itself that provided the spark. Moreover, the VIX does NOT measure the swings in stock prices. The VIX is calculated from the pricing of options on the S&P 500 (SPY). So sourcing the angst has to go straight to the desire of investors, likely big institutions, to hedge large portfolios of stock holdings with index put options. I pointed out the surprising rise in the VIX starting in mid-January even as the S&P 500 continued to race higher. Traders and investors likely started the rush to protect their portfolios at that time. The trading action formed the basis for my rush to go LONG volatility. If only I stayed with that trade for a few weeks, but I was overly focused on a specific week of events as a potential VIX driver!
It is also important to remember that the VIX is just ONE volatility product of many. For example, the Cboe Global Markets (CBOE) created the VIX as one of many of its financial services. CBOE was summarily punished when related VIX products blew up last week.
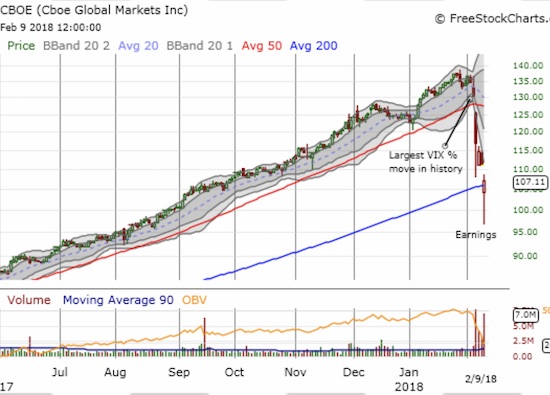
Source: FreeStockCharts.com
The punishment for CBOE extended into the aftermath of its earnings report. I found the following quote from the Seeking Alpha transcript of the conference call particularly informative (emphasis mine):
“What we can say is that, there are literally a dozen or more volatility trading strategies that our market participants employ, all the way from calendar spreads and rope [ph] strategies to ARB strategies to long and short of a variety of stripes; short term short, long term short, long term long, short term long.
So this is a strategy of many, and outside the ETPs, those who employ the short VIX strategy are true, true professionals. So this gets back to the point we made earlier that, the short VIX strategy is not going away. In particular, for those market participants. We have seen it already in the last couple of days since the volatility spike, and we have an event like we had earlier this week, in terms of the short VIX strategy performance. When the volatility level, when the level of VIX doubles, increases by 100%, once you increase by 100%, and you reset to historic norms, you don’t increase by 100% again. So it’s really an exceptional event, when the level of VIX increases doubles in a matter of just a handful of days. That’s occurred, and now we are at a point where — and professionals know this, we are at a point where the short VIX strategy tends to work quite well.”
In other words, this event was certainly painful for those who got caught on the wrong side – and QUITE profitable for the handful of people who stuck to the counter bet like Denver hedge fund Ibex Investors – but nothing has fundamentally changed about the nature of fear. Market fear is hard to sustain over long periods of time, and, at some point likely soon, institutions will have their fill of S&P 500 puts. The lower demand will begin to lower options pricing and create a downward bias for the VIX that will shave down the incidence of extremes.
A year ago, I referenced an article that offered CBOE as the best way to bet on trading in volatility. I later lamented never making that trade. CBOE gained a market-beating 68.6% in 2017. Even with the current sell-off, the CBOE is just back to where it was between last August and September. I am watching its test of 200DMA support with GREAT interest…as a potential buyer.
Be careful out there!
Full disclosure: long UVXY puts, long SVXY calls