
AT40 = 57.0% of stocks are trading above their respective 40-day moving averages (DMAs)
AT200 = 58.8% of stocks are trading above their respective 200DMAs
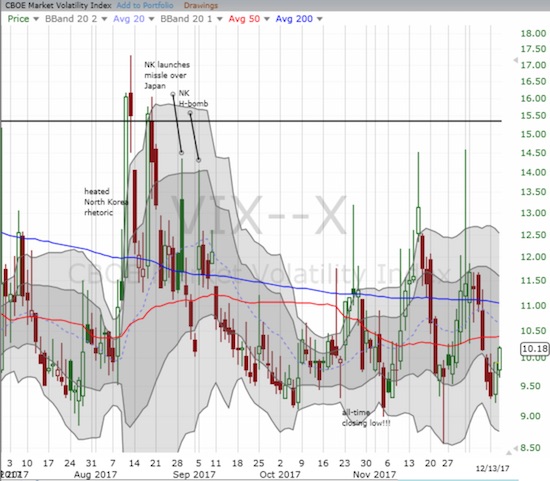
VIX = 10.2
Short-term Trading Call: cautiously bullish
Commentary
The stock market is looking a little tired.
The S&P 500 (SPY) closed at another all-time high on Tuesday and at one point hit a new all-time intraday high. Buyers tried again today (Wednesday) but failed as a post-Fed fade closed the index with the smallest of losses.
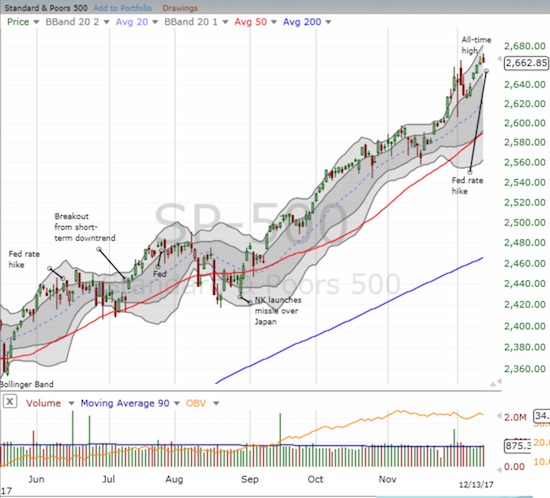
The above chart does not look like much cause for pause until the covers roll back with AT40 (T2108), the percentage of stocks trading above their respective 40-day moving averages (DMAs). Ten trading days ago, AT40 lost its bid to hit overbought levels as it faded from an intraday high of 66.4% and closed at 60.7%. The past two trading days suggest AT40 is losing its battle to regain that momentum. My favorite technical indicator faded from highs twice and closed today at 57.0%. In other words, AT40 is back to playing spoiler with non-confirmations of the all-time highs on the major indices.
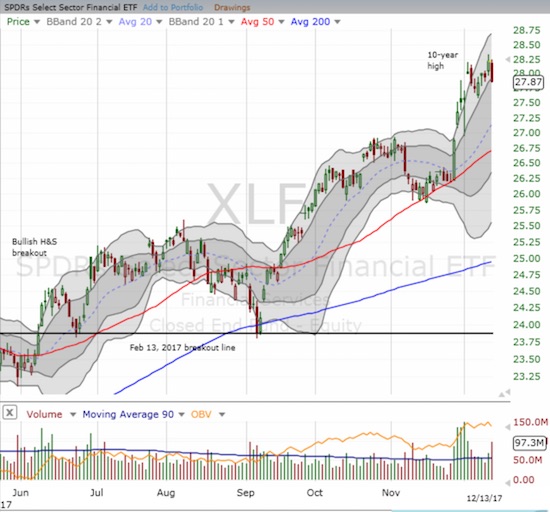
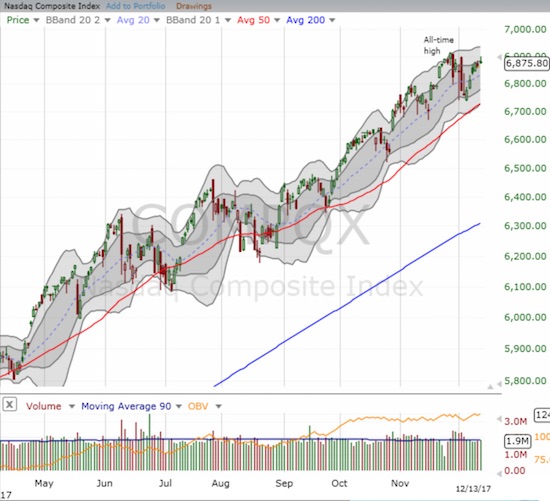
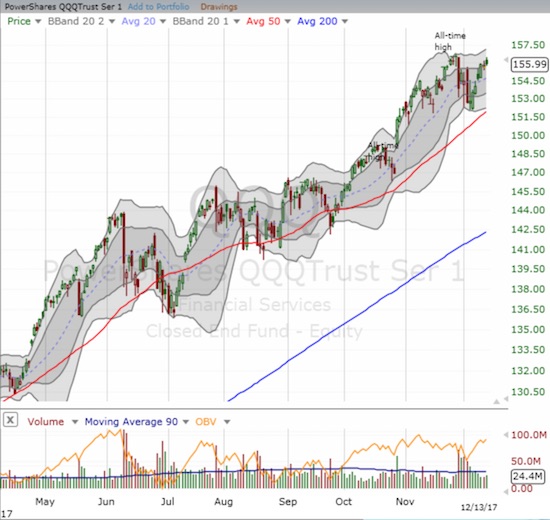
Other major indices show subtle signs of fatigue. The iShares Russell 2000 ETF (IWM) has yet to mount a comeback since it started December with a notable tumble from an all-time high. The Financial Select Sector SPDR ETF (XLF) rallied strongly into the latest statement on monetary policy from the Federal Reserve only to end today with a 1.2% loss. The NASDAQ and the PowerShares QQQ ETF (QQQ) bounced off December lows but slowed down significantly into the approach to the all-time high.
The volatility index, the VIX, is back to extremely low levels but gained ground the past two days. It looks poised for another one of those quick roundtrips through a volatility spike. Recall that the VIX historically spends precious little time below 10 and not much more time below 11.
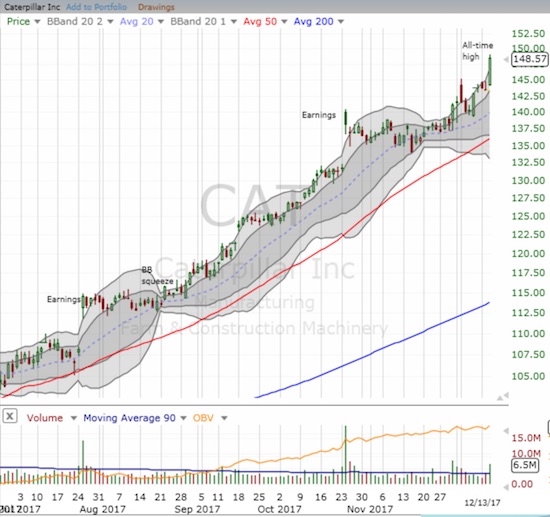
Industrials, like Caterpillar (CAT), are the main stocks reminding everyone that the bull’s momentum remains fierce. The stock gained a healthy 3.6% on the heels of its latest sales report. CAT is up over 50% year-to-date!
Ode To Janet Yellen
One of the main headlines for the day was of course the latest rate hike from the U.S. Federal Reserve. The accompanying statement contained no surprises as the Fed continued its pattern of telegraphing its moves and moods well in advance of action. However, I think it is important to point out that (aggregate) inflationary pressures are still nowhere to be found:
“On a 12-month basis, both overall inflation and inflation for items other than food and energy have declined this year and are running below 2 percent. Market-based measures of inflation compensation remain low; survey-based measures of longer-term inflation expectations are little changed, on balance.”
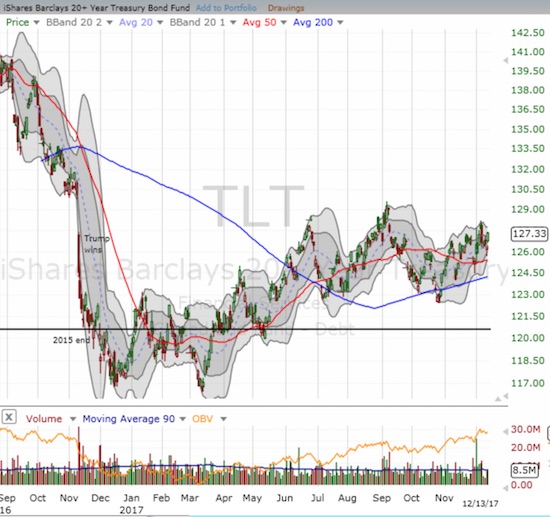
Below target inflation is eventually going to slam into the Fed’s rate hike regime. Tax reform may be the salve that finally brings inflationary pressures as an already healthy, high employment economy is about to get a lot more stimulus. The lack of inflationary pressure also comes through in the ability of the iShares 20+ Year Treasury Bond ETF (TLT) to keep flirting with its high of the year. Fed rate hikes have done little to nothing to push long-term rates higher – meaning the yield curve continues to flatten. Note that Yellen cautioned against reading too much into this development, particularly because “things have changed” that suggest the yield curve should be flatter than in the past and the yield curve is still within historic norms anyway.
The Fed rate hike had minimal impact on market expectations for the next rate move.
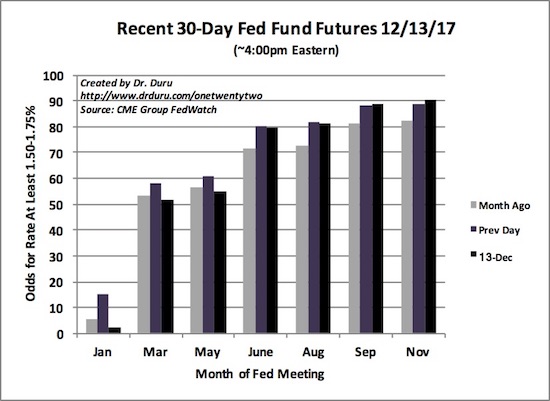
Source: CME FedWatch Tool
The impact on the U.S. dollar index (USD) was notable in that the market rolled back about half of the gains for the month.
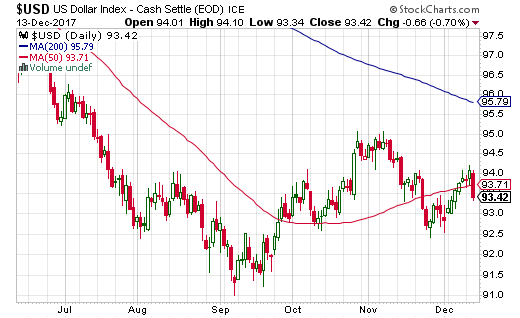
Source: StockCharts.com
Barring any emergencies, Janet Yellen made her last appearance in a press conference as the Chair of the Federal Reserve. I personally think it is too bad Yellen was not allowed to leave on her own terms like her recent predecessors, but at least she has handled her removal from office with grace. The disappointment was expressed by one reporter who noted the melancholy she heard from numerous female economists.
Reporters also peppered Yellen with questions about tax reform and Bitcoin (BTC). It was interesting to hear Yellen attribute at least part of this year’s rally in the stock market to anticipation over tax reform. She doubted that 4% economic growth was a likely outcome of tax cuts but said the Fed would welcome such growth. She also acknowledged that should a recession come, the space for a fiscal response will be limited by the existing proposals for tax cuts. On Bitcoin, Yellen was of course careful to note that the cryptocurrency is not legal tender, and the Fed has no role in regulating its use. She does not see any risk to the financial system from the wild fluctuations in Bitcoin.
Janet Yellen's final answer at her final press conference:
"Let me emphasize that correlation is not causation.”
That's how an economist goes out in style, folks.
— Binyamin Appelbaum (@BCAppelbaum) December 13, 2017
Janet Yellen’s last press conference as Fed Chair
STOCK CHART REVIEWS
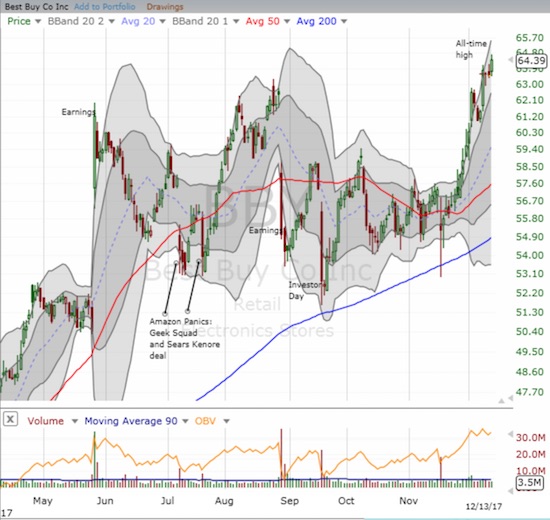
Best Buy (BBY)
Best Buy actually broke out to new all-time highs over the past week – yet one more sign that retail is ready to rock for 2018 and get over its rolling Amazon.com (AMZN) panics.
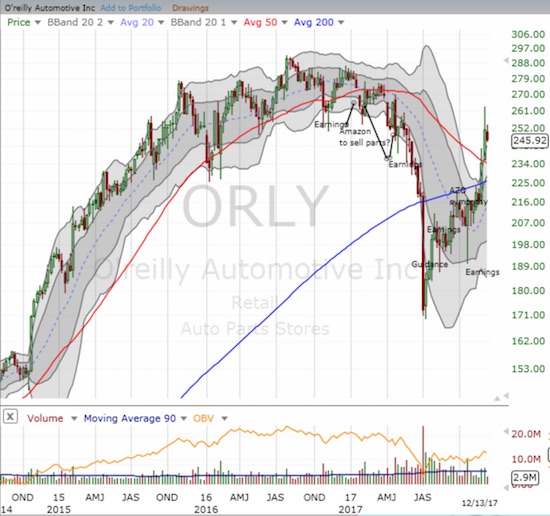
O’Reilly Automotive, Inc. (ORLY)
I got a kick out of Jim Cramer’s recent segment pointing out the bottom in the stocks of auto parts retailers; Cramer is back on board with these stocks after earlier shying away partially because of the threat of Amazon’s encroachment. I have documented this bottoming process for some time now. However, note that I took my profits in ORLY last week after it gapped up in sympathy with Autozone (AZO) earnings. At that point, the stock was once again well above its upper-Bollinger Band (BB). While the stock did fade from there, it is so far hanging tough. Still, the stock is up a LOT from its 2017 multi-year low. I am content to wait for the next wave of angst to buy back in (assuming such an opportunity comes again).
— – —
FOLLOW Dr. Duru’s commentary on financial markets via email, StockTwits, Twitter, and even Instagram!
“Above the 40” uses the percentage of stocks trading above their respective 40-day moving averages (DMAs) to assess the technical health of the stock market and to identify extremes in market sentiment that are likely to reverse. Abbreviated as AT40, Above the 40 is an alternative label for “T2108” which was created by Worden. Learn more about T2108 on my T2108 Resource Page. AT200, or T2107, measures the percentage of stocks trading above their respective 200DMAs.
Active AT40 (T2108) periods: Day #454 over 20%, Day #268 over 30%, Day #68 over 40%, Day #16 over 50% (overperiod), Day #7 under 60% (underperiod), Day #42 under 70%
Daily AT40 (T2108)
")
Black line: AT40 (T2108) (% measured on the right)
Red line: Overbought threshold (70%); Blue line: Oversold threshold (20%)
Weekly AT40 (T2108)

*All charts created using freestockcharts.com unless otherwise stated
The charts above are my LATEST updates independent of the date of this given AT40 post. For my latest AT40 post click here.
Related links:
The T2108 Resource Page
You can follow real-time T2108 commentary on twitter using the #T2108 or #AT40 hashtags. T2108-related trades and other trades are occasionally posted on twitter using the #120trade hashtag.
Be careful out there!
Full disclosure: long UVXY calls, long and short positions on the U.S. dollar
*Charting notes: FreeStockCharts.com uses midnight U.S. Eastern time as the close for currencies. Stock prices are not adjusted for dividends.