
AT40 = 60.6% of stocks are trading above their respective 40-day moving averages (DMAs)
AT200 = 59.6% of stocks are trading above their respective 200DMAs
VIX = 11.4
Short-term Trading Call: cautiously bullish
Commentary
I call it a mini panic dip.
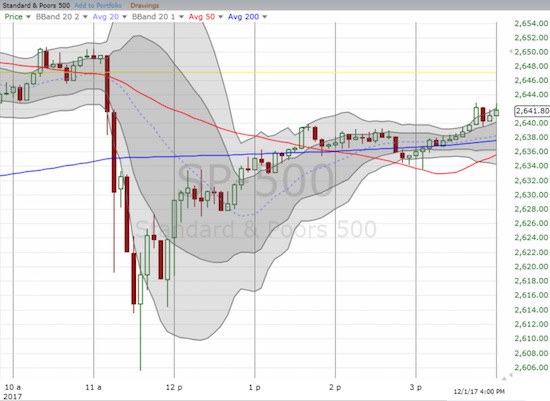
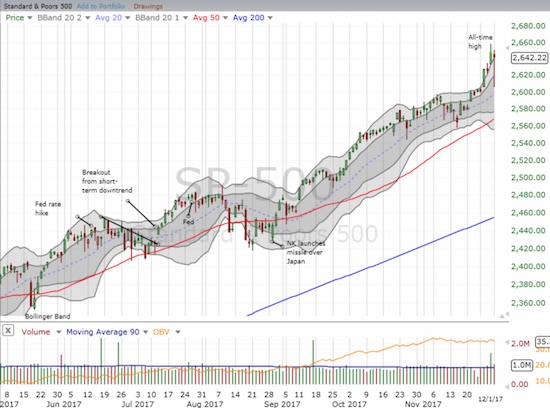
Political news roiled the stock market for a brief moment, a grand 30 minutes in total (it sure seems like these dips get shorter and shorter in duration!). The market was buffeted by the cross-currents of President Trump’s potentially deepening legal troubles (allegations which later led to clarifications, corrections, and a suspension) and the promise of tax reform winning the day in Congress. In the end, the buyers won as has been the case for a very long time. The S&P 500 (SPY) ended the day with a tiny fractional loss of 0.2%.
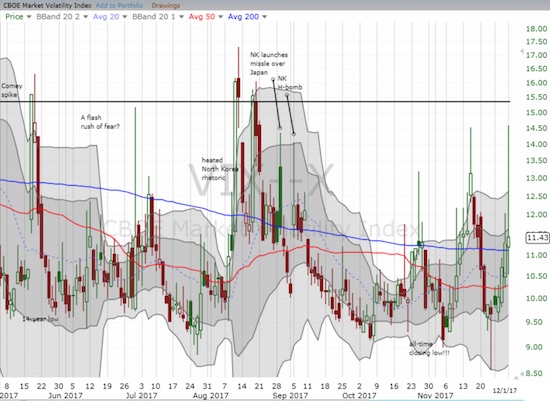
The volatility index, the VIX, suffered one of its worst one-day fades in a long time. The temporary angst drove the VIX as high as 14.58 and a 29% gain. The VIX ended the day with a paltry 1.3% gain. Per the trading plan I outlined in the last Above the 40 post, I sold my latest tranche of call options on the ProShares Ultra VIX Short-Term Futures (UVXY). The trade was good for a little over a double. I am not sure yet what conditions will motivate me to pull the trigger yet again.
I read an interesting piece in Business Insider about a “mystery trader” who keeps rolling a massive bet on a spike in volatility. Apparently, the big bet started as a bet on a volatility spike by October. September and October were of course uncharacteristically calm and August absorbed all the big volatility hits instead. Apparently, the August move was not enough, and the trader rolled the position to a bet on a volatility spike by December. Now, the bet targets January. Business Insider relied on Bloomberg for this information.
I am intrigued by the configuration of the bet. The trader sold around 260,000 VIX January $12 puts to fund the purchase of a VIX January $15/25 call spread. The call spread has a ratio of 1:2 with 260,000 $15s and 520,000 $25s. This is a very intricate bet because the trader cannot afford to see volatility spike “too much” by the time s/he closes out the position. However, since the VIX last soared over 25 in June, 2016 with the Brexit vote, history is on the side of this trader. YET, if volatility remains in this period of extremely low volatility, the trader may have to accept a substantial loss…unless the position gets rolled again in time to avoid a major loss.
I do not think this is a case where a trader thinks s/he knows something the rest of us do not understand. This trade looks like a structured approach for betting on the timing for the end of this historically extended period of extremely low volatility.
AT40 (T2108), the percentage of stocks trading above their respective 40-day moving averages (DMAs), took a deep dive and confirmed that the selling in the market was broad based. My favorite technical indicator fell all the way from 60.5% to 50.0%. AT40 ended the day at 60.6%. Along with the S&P 500, AT40 looks ready to resume the previous momentum.
STOCK CHART REVIEWS
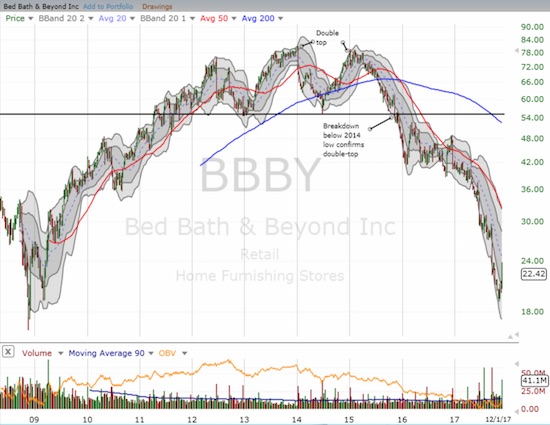
Bed Bath & Beyond Inc. (BBBY)
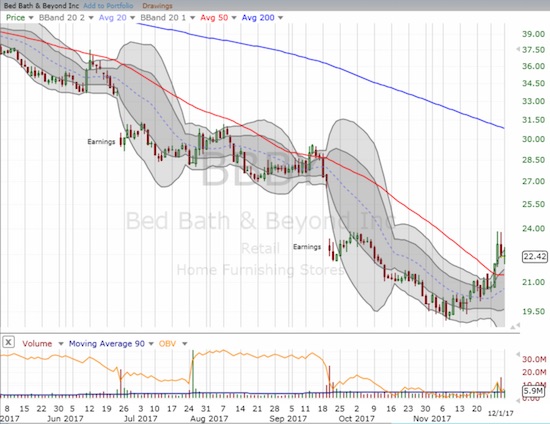
The hunt is on for 2018 bargains, and one investor gave BBBY a good look. I was intrigued by the potential because sellers have truly beaten the stuffing out of BBBY. The owner of Cost Plus World Market, Christmas Tree Shops, buybuy BABY, Linen Holdings, Chef Centra, and of course Bed Bath & Beyond has a paltry 0.3 price/sales ratio, 5.7 trailing P/E, and a 8.2 forward P/E. At its lows last month, BBBY traded within a hair of its March, 2009 low. BBBY is a stock that is one positive catalyst away from a massive run-up. Last week’s rotation into retail lifted the stock into a 50DMA breakout. This breakout is BBBY’s fourth of the year, so the stock still has plenty to prove. A close at a new post-earnings high would provide a good start.
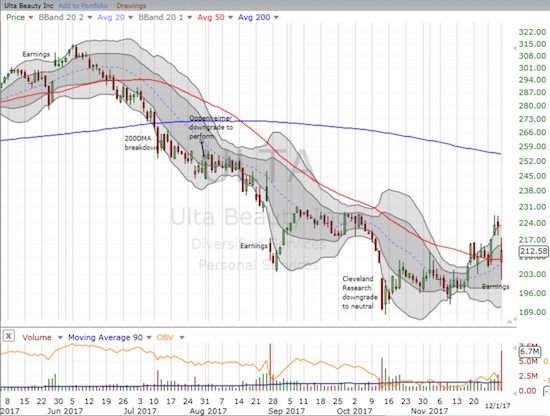
Ulta Beauty (ULTA)
ULTA failed the earnings test, but its bottom remains well intact. Even more importantly, after a lot of churn, the stock closed above its 50DMA support. ULTA reaffirmed its guidance for 2017, but apparently investors were displeased with lower margins. If ULTA breaks its post-earnings low, I will assume sellers are once again taking over.
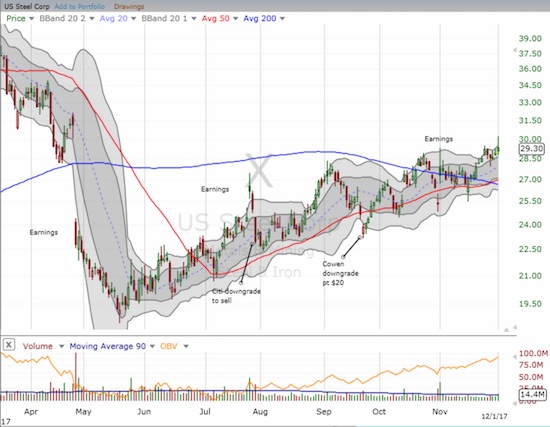
U.S. Steel (X)
U.S. Steel continues to melt higher. Analysts tried to take the stock down but failed. Earnings generated a gap up. The reversal of post-earnings gains quickly transitioned into a a fresh 200DMA breakout. The 50DMA held as support. All thees features add up to an on-going bullish story for X on this post-collapse recovery. A fill of the April gap down is right around the corner.
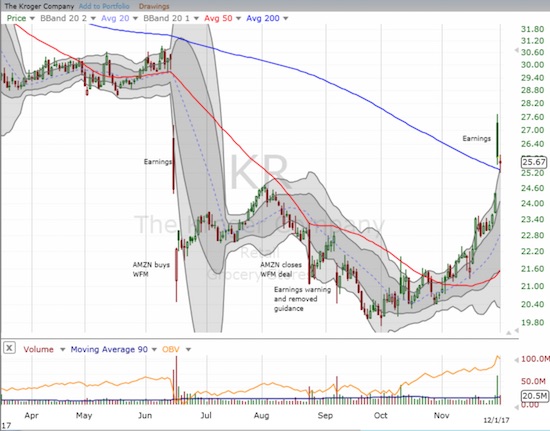
Kroger (KR)
Speaking of recoveries, Kroger’s earnings all but put the Amazon panic to bed with a tremendous earnings performance last week. I promptly sold my call options into the buying frenzy. I covered my short put option a few weeks ago as it fell near worthless.
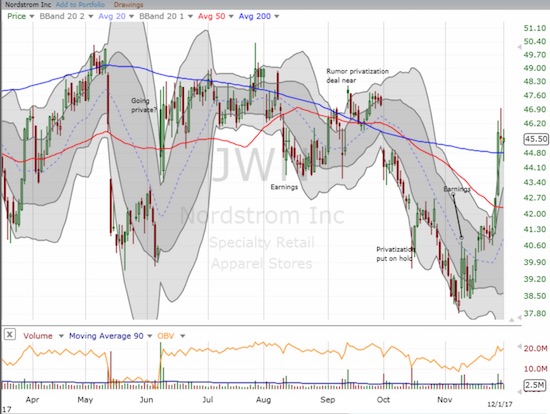
Nordstrom (JWN)
Some key retailers are delivering a solid recovery action ahead of next year. Nordstrom was hit in October when the company ended its efforts to privatize. I used that sell-off as another buying opportunity. A post-earnings bounce appeared to confirm a bottom. Last week’s strong rotation into retail stocks gave me my opportunity to complete another profitable trade on JWN.
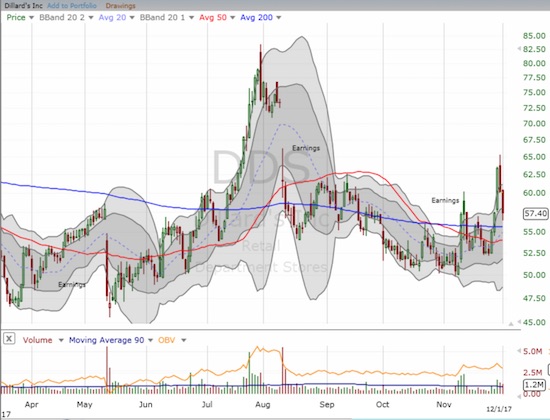
Dillard’s (DDS)
Dillard’s is a VERY intriguing retail play. Short interest is an incredible 60.0% (yes, SIXTY) of float. Ahead of earnings, I decided to speculate on the bearish side ahead of earnings with a put spread. DDS inadvertently released earnings before the market closed, and the stock promptly rallied. DDS benefited from last week’s rotation into retail but its pullback the last two days was surprisingly steep. Sellers returned in heavy volume and managed to completely reverse Wednesday’s gain. I am now looking to see whether 50 or 200DMA support can hold. DDS will return to bearish territory if it breaks November’s low. The shorts will be under increasing pressure if support holds.
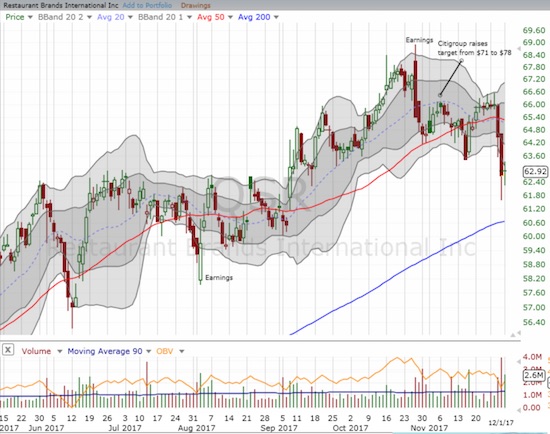
Restaurant Brands International Inc. (QSR)
QSR is the company that made a chicken trade earlier this year by buying Popeyes Louisiana Kitchen (PLKI). The stock’s rally took an ever so brief pause after that news. Last week, the stock took a surprising downturn as it broke below its 50DMA and made a new post-earnings low. “Something” is not right here, especially given the post-earnings upgrade from Citigroup. So I am back to watching QSR closely.
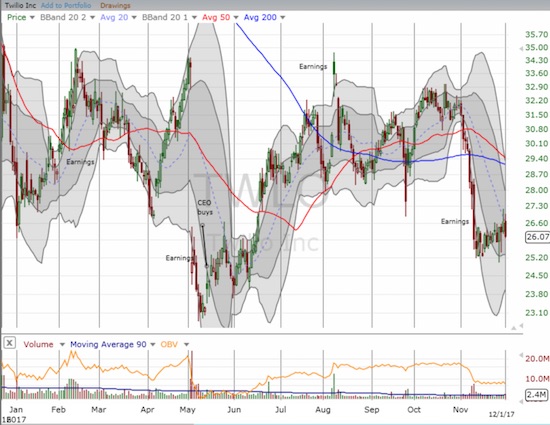
Twilio (TWLO)
Speaking of “something” not being right, TWLO broke down last month going into earnings. It proceeded to sell off again the day following earnings. While the stock has managed to consolidate since then, the performance was very disappointing given the CEO expressed enough confidence in the company to load up on more stock near or at the all-time low in May. I took some of the profits from my last TWLO trade to buy calls after the post-earnings selling in August. I figured the CEO’s confidence would translate into a relatively quick recovery. The stock never did fully recover. I am content now just to see how much salvage value I can get on my current position. Otherwise, I am watching to see whether the stock retests its all-time low.
— – —
FOLLOW Dr. Duru’s commentary on financial markets via email, StockTwits, Twitter, and even Instagram!
“Above the 40” uses the percentage of stocks trading above their respective 40-day moving averages (DMAs) to assess the technical health of the stock market and to identify extremes in market sentiment that are likely to reverse. Abbreviated as AT40, Above the 40 is an alternative label for “T2108” which was created by Worden. Learn more about T2108 on my T2108 Resource Page. AT200, or T2107, measures the percentage of stocks trading above their respective 200DMAs.
Active AT40 (T2108) periods: Day #446 over 20%, Day #260 over 30%, Day #60 over 40%, Day #8 over 50%, Day #2 over 60% (overperiod), Day #34 under 70%
Daily AT40 (T2108)
")
Black line: AT40 (T2108) (% measured on the right)
Red line: Overbought threshold (70%); Blue line: Oversold threshold (20%)
Weekly AT40 (T2108)

*All charts created using freestockcharts.com unless otherwise stated
The charts above are my LATEST updates independent of the date of this given AT40 post. For my latest AT40 post click here.
Related links:
The T2108 Resource Page
You can follow real-time T2108 commentary on twitter using the #T2108 or #AT40 hashtags. T2108-related trades and other trades are occasionally posted on twitter using the #120trade hashtag.
Be careful out there!
Full disclosure: long TWLO calls, long ULTA calls
*Charting notes: FreeStockCharts.com uses midnight U.S. Eastern time as the close for currencies. Stock prices are not adjusted for dividends.
Regarding the massive VIX trade: unless the trader’s broker is leaking complete info to Bloomberg, there is no way to know whether the trade is actually a hedge on a long or short position, perhaps in a highly liquid volatility ETF like UVXY or VXX. Such a position would drastically change the behavior of the overall portfolio.
Yeah. That’s why I included the source of the info. It is possible that someone is leaking the info to encourage bandwagon trades. It is definitely possible the trader is simply hedging a massive long portfolio. I should have added I find it intriguing that such a large trade is getting exposed like this. Such news typically invites people to fade the position. But since this is a broad index, the trader may be safe against sharks!