
The February 4, 2016 edition of Nightly Business Report included a segment assessing the ability of the stock market to predict recessions. This is of course a timely piece given the stock market’s current plunge and growing recession fears arising from analyst commentary and softening economic data.
Steve Liesman, chief economist for CNBC, took a crack at this age-old question. He used S&P 500 (SPY) price data going back to 1945, the post-war era. He overlayed these data with the timing of bear markets. This periods covers 13 bear markets and 11 recessions. A bear market occurs after the S&P 500 loses 20% from its last all-time high.
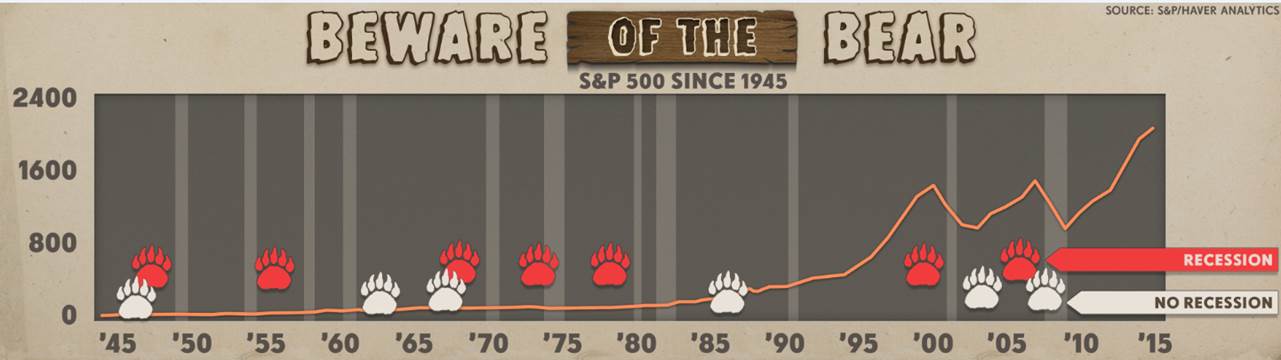
Source: NBR
Liesman counted a successful prediction if the bear market occurred within one year ahead of the recession, with some wiggle room for a few days. This definition created a 53% historical fraction of bear markets preceding a recession (7 out of 13 bear markets were followed by a recession). I am purposely not using the term “predict” as Liesman does because the sample is so small. Moreover, Liesman does not consider the false negative: 4 of the 13 recessions were not preceded by bear markets. Regardless, 53% is nothing to write home about; it is not an actionable likelihood.
The link between bear markets and recessions interests traders and investors differently than economists. In so many cases, a bear market is well underway or even almost over by the time an official recession occurs. Moreover, we do not know a recession has officially occurred until at least two quarters after the start. This makes a recession a time for traders to consider closing out shorts and a time for long-term investors to count their pennies and load up on cheap stocks. Traders and investors are much more interested in the precursors of bear markets than recessions.
The S&P 500 is currently down 12% from its last all-time high set on May 21, 2015. A bear market would take the index back to around 1704, a level last seen October, 2013. Given the on-going destruction in commodity-related stocks and now a swath of growth stocks, such an extended sell-off should create a whole host of stocks too cheap to ignore. The all-time high set in the last bull market was around 1575. A retest of that support would mark a 26% decline from this bull market’s all-time high. I consider both 1704 and 1575 in play if the S&P 500 fails to hold its intraday low from the last oversold period.
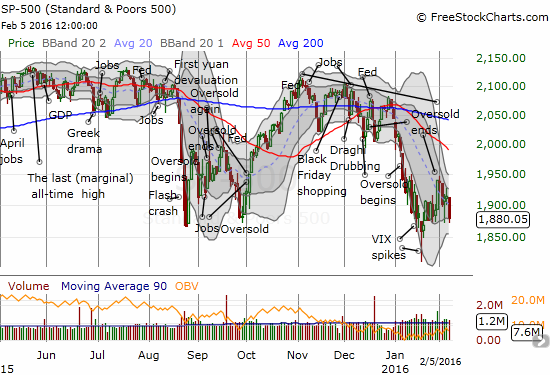
Source: FreeStockCharts.com
Be careful out there!
Full disclosure: long SSO call options and shares