
(T2108 measures the percentage of stocks trading above their respective 40-day moving averages [DMAs]. It helps to identify extremes in market sentiment that are likely to reverse. To learn more about it, see my T2108 Resource Page. You can follow real-time T2108 commentary on twitter using the #T2108 hashtag. T2108-related trades and other trades are occasionally posted on twitter using the #120trade hashtag. T2107 measures the percentage of stocks trading above their respective 200DMAs)
T2108 Status: 14.9%
T2107 Status: 14.9%
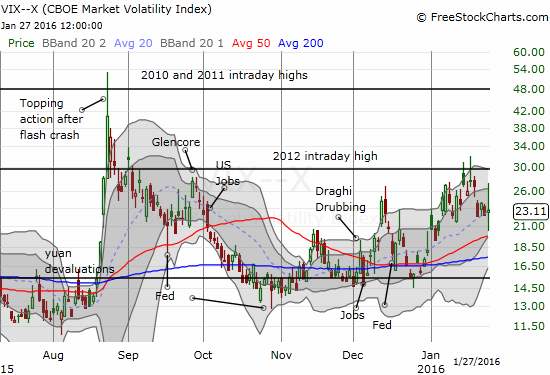
VIX Status: 23.1 (ranged from 20.4 to 27.2)
General (Short-term) Trading Call: bullish
Active T2108 periods: Day #14 under 20%, Day #17 under 30%, Day #33 under 40%, Day #37 below 50%, Day #52 under 60%, Day #393 under 70%
Commentary
The Federal Reserve delivered the perfect “no new news” statement. It defied my expectation for delivering something substantial relative to the current context of market volatility. Media outlets of course tried to make headlines out of the Fed’s latest pronouncements on monetary policy, but fundamentally, nothing changed. The Fed reiterated its data-dependent approach to normalizing rates at a snail’s pace. It was a stalemate kind of day as a result. Notably, the trend pushing out the date of the next rate hike continued: September is now the first month where the odds go above 50%. Media outlets that claim the Fed’s statement keeps a March rate hike in play are off-base.
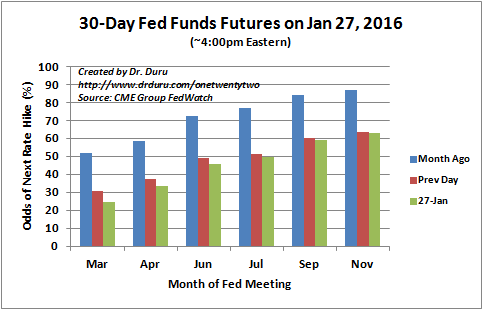
Source: CME Group Fedwatch
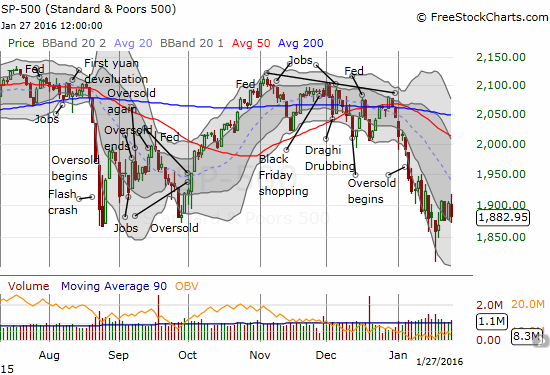
T2108, the percentage of stocks trading above their respective 40-day moving averages (DMAs), nudged downward to 14.9% after ranging from 13.1% to 17.7%. At one point, the S&P 500 (SPY) was making a breakout move at its highs -an end to the oversold period seemed near. Instead, the index closed down 1.1% to stay within a tight 4-day trading range of alternating up and down days.
The volatility index, the VIX, experienced the most dramatic stalemate. It ranged from 20.4 to 27.2 before closing with a mere 2.7% gain. This means my pre-Fed fade of volatility is actually not likely to work this time around.
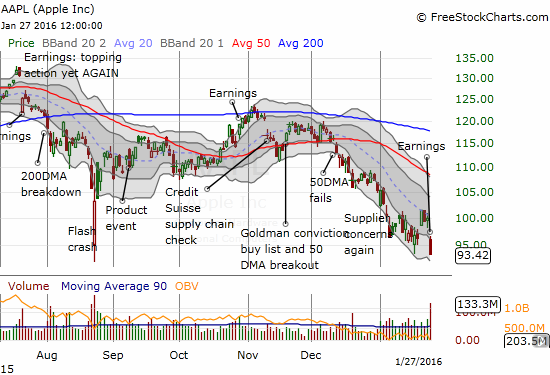
Much bigger and more important than the Fed for the regular trading day were Apple (AAPL) and Netflix (NFLX).
Like the last earnings cycle, Apple opened for post-earnings trading on a Fed day. Apple (AAPL) closed down 6.6%. It was a move consistent with the Apple pre-earnings trade and confirmed that AAPL remains a very sick stock. The following commentary on China put as good a face as possible on Apple’s business there, but the softening in Hong Kong caught the headlines (emphasis mine, quote from Seeking Alpha transcripts):
“We know the conditions in China have been a source of concern for many investors. Last summer, while many companies were experiencing weakness in their China-based results, we were seeing just the opposite, with incredible momentum for iPhone, Mac and the App Store, in particular.
In the December quarter, despite the turbulent environment, we produced our best results ever in Greater China, with revenue growing 14% over last year, 47% sequentially, and 17% year-over-year in constant currency. These great results were fueled by our highest ever quarterly iPhone sales and record App Store performance.
Notwithstanding these record results, we began to see some signs of economic softness in Greater China earlier this month, most notably in Hong Kong. Beyond the short-term volatility, we remain very confident about the long-term potential of the China market and the large opportunities ahead of us and we are maintaining our investment plans.
Despite the economic challenges all over the world, Apple remains incredibly strong.”
The market has already become accustomed to a weak Apple. However, the growing weakness in Netflix (NFLX) is something new. The post-earnings fade in NFLX continues with a confirmed 200DMA breakdown.
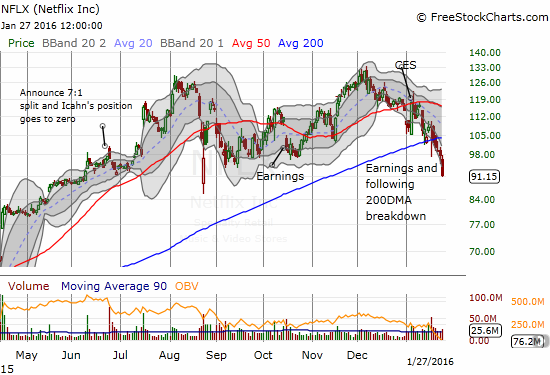
Now the big question: is market leadership and participation narrowing even further or are new leaders emerging? How long can NFLX and the general stock market continue to diverge? Which one will blink first?
— – —
For readers interested in reviewing my trading rules for T2108, please see my post in the wake of the August Angst, “How To Profit From An EPIC Oversold Period“, and/or review my T2108 Resource Page.
Reference Charts (click for view of last 6 months from Stockcharts.com):
S&P 500 or SPY
U.S. Dollar Index (U.S. dollar)
EEM (iShares MSCI Emerging Markets)
VIX (volatility index)
VXX (iPath S&P 500 VIX Short-Term Futures ETN)
EWG (iShares MSCI Germany Index Fund)
CAT (Caterpillar).
IBB (iShares Nasdaq Biotechnology).
Daily T2108 vs the S&P 500
")
Black line: T2108 (measured on the right); Green line: S&P 500 (for comparative purposes)
Red line: T2108 Overbought (70%); Blue line: T2108 Oversold (20%)
Weekly T2108

*All charts created using freestockcharts.com unless otherwise stated
The charts above are the my LATEST updates independent of the date of this given T2108 post. For my latest T2108 post click here.
Related links:
The T2108 Resource Page
Expanded daily chart of T2108 versus the S&P 500
Expanded weekly chart of T2108
Be careful out there!
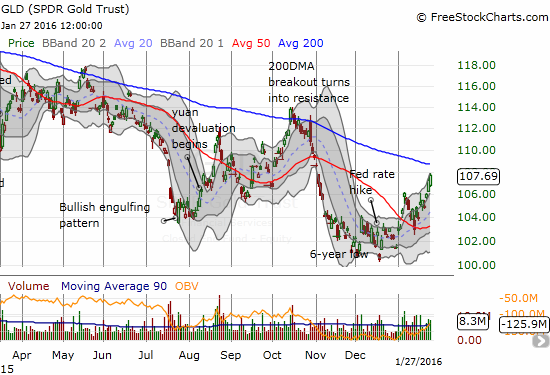
Full disclosure: long SVXY shares, long and short UVXY put options, long SSO call options, long SSO shares, long GLD