
(T2108 measures the percentage of stocks trading above their respective 40-day moving averages [DMAs]. It helps to identify extremes in market sentiment that are likely to reverse. To learn more about it, see my T2108 Resource Page. You can follow real-time T2108 commentary on twitter using the #T2108 hashtag. T2108-related trades and other trades are occasionally posted on twitter using the #120trade hashtag. T2107 measures the percentage of stocks trading above their respective 200DMAs)
T2108 Status: 42.9%
T2107 Status: 27.1%
VIX Status: 18.8
General (Short-term) Trading Call: bearish
Active T2108 periods: Day #32 over 20%, Day #31 over 30%, Day #2 over 40% (overperiod), Day #4 below 50%, Day #6 under 60%, Day #346 under 70%
Reference Charts (click for view of last 6 months from Stockcharts.com):
S&P 500 or SPY
SDS (ProShares UltraShort S&P500)
U.S. Dollar Index (volatility index)
EEM (iShares MSCI Emerging Markets)
VIX (volatility index)
VXX (iPath S&P 500 VIX Short-Term Futures ETN)
EWG (iShares MSCI Germany Index Fund)
CAT (Caterpillar).
IBB (iShares Nasdaq Biotechnology).
Commentary
The S&P 500 (SPY) failed its first big test since confirming a failure to break into overbought territory. The index rallied right to its 200-day moving average (DMA) and then faded in picture-perfect form (who says 50 and 200DMAs do not matter?!?!). This follows a strong rally on Monday that seemed to demonstrate support at the 50DMA.
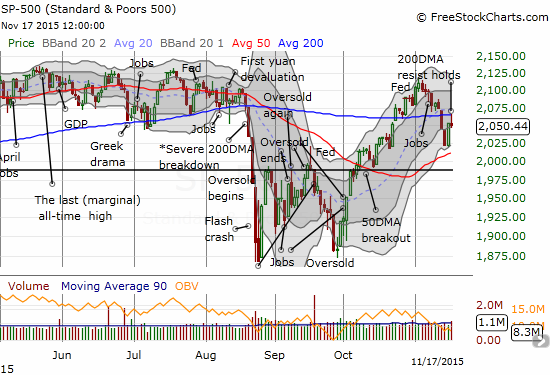
T2108 closed at 42.9%. Monday’s bounce once again demonstrated how strongly T2108 can surge after dropping into the 30% range.
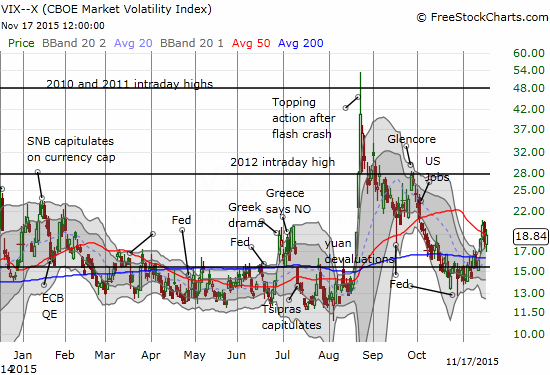
The volatility index has gyrated along with the market. It remains elevated above the 15.35 pivot and still looks like it is ready to resume lift-off.
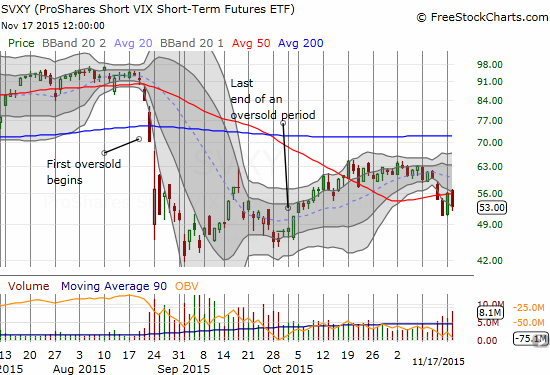
At the open, I put in a small order for call options on the ProShares Ultra VIX Short-Term Futures ETF (UVXY). I wanted to use the position as a small play on a fade of the S&P 500. The low-ball order never filled. UVXY went on to print a nice 10.6% gain. While my trading call remains bearish, I am now on watch for an opportunity to play ProShares Short VIX Short-Term Futures ETF (SVXY) for a quick bounce. (I put in a low-ball order for shares on Monday morning that never filled. Like UVXY, I missed out on a nice day trade). Note how SVXY is struggling with its 50DMA. I want to buy the next time it over-extends below the lower-Bollinger Band.
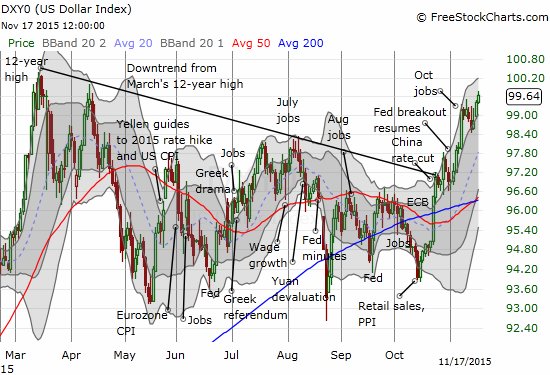
Another interesting development is the on-going rally in the U.S. dollar index (DXY0). The on-going rally is crawling along. Still, the ability for more gains going into what will likely be a Fed rate hike in December suggests that the market has yet to fully price in the likely imminent start of Fed normalization. I am interested to see how much more the S&P 500 can rally with on-going upward momentum in the U.S. dollar.
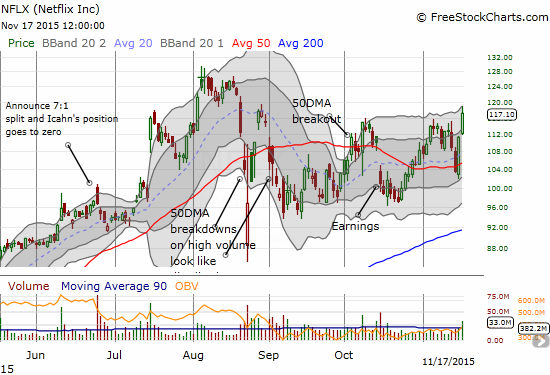
Netflix (NFLX) is one stock that has sprung to life this week. I made the mistake of trying to fade a 50DMA breakout (with put options). I should have followed the standard trading rule book and BOUGHT the breakout. NFLX has gained 13.0% in just two days. Today’s close represents a minor breakout to a near 3-month high.
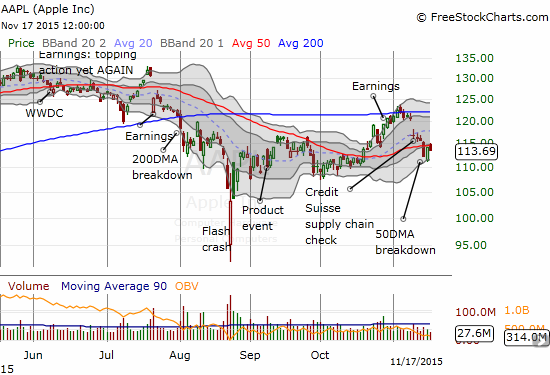
While NFLX is breaking out again, Apple (AAPL) is struggling with its 50DMA, now resistance. I neglected to note in the last T2108 Update that AAPL broke through 50DMA support. That was strike #2 for AAPL. Strike #1 was gapping down earlier that week to finish a complete reversal of its post-earnings gains.
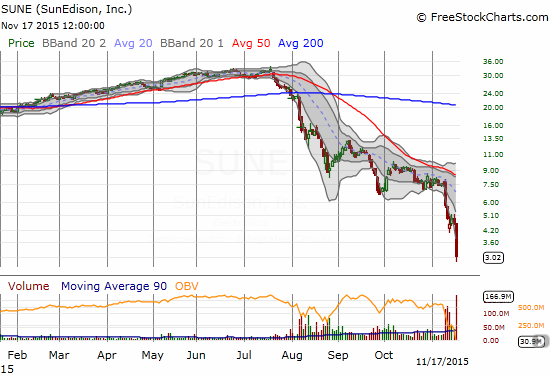
Yesterday, I wrote about some bullish setups in solar stocks. Thanks to more drama at SunEdison, Inc. (SUNE), solar stocks sold off in sympathy and provided me cheaper entry points for call options on Solar City (SCTY) and First Solar (FSLR). SunPower (SPWR) is now looking bearish as a 6.8% drop took it to a new ow below 50DMA resistance. Canadian Solar (CSIQ) invalidated its 50DMA setup by closing ever so slightly below support with a 6.2% loss.
I think SUNE’s chart is “enough said” for that company. Seeking Alpha provides a short summary of the latest damaging news for SUNE; I even read the comments because I am always fascinated to understand how investors process these plunges. The die-hard bulls are the most fascinating of all. With a trend like this though, you do not really need news to see the unfolding disaster.
Needless to say, I am not so confident anymore in any of the bullish setups on solar stocks!
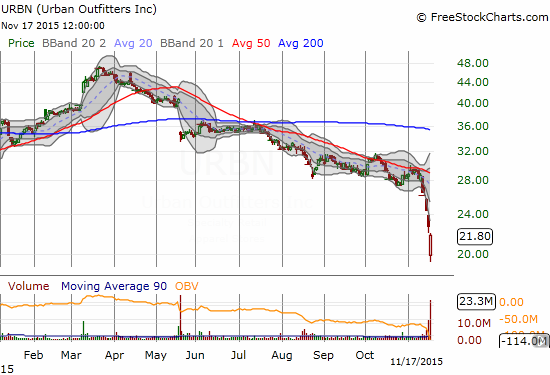
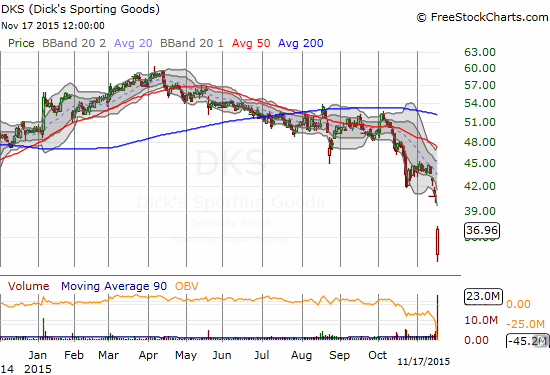
Finally, the hits keep coming in retail. On Friday, the SPDR S&P Retail ETF (XRT) almost closed at a 52-week low. I cannot emphasize enough the bearishness of this sell-off in retail given expectations for a consumer spending binge thanks to plunging oil prices. I wrote about my doubts last December in “The Uncertain Impact of Lower Oil and Gas Prices On Consumer Spending.” Two of the latest retailing victims of post-earnings sell-offs are Urban Outfitter (URBN) and Dick’s Sporting Goods (DKS). The charts are “enough said.” In both cases, falling trends for much of the year told you everything you needed to know. (Having said that, I DO like the strong bounces off the lows of the day – in both cases, I failed to try my typical reversal trade when a stock plunges well below its lower-Bollinger Band).
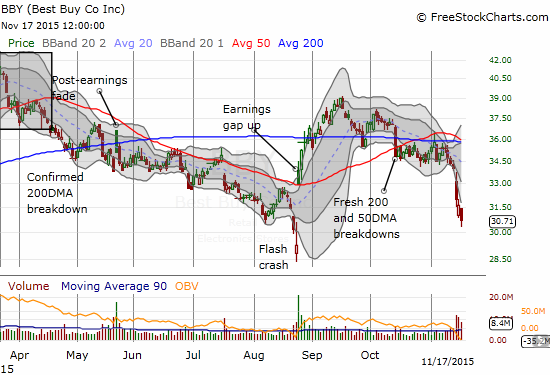
Best Buy (BBY) reports earnings on the morning of November 19th. Given the carnage in retail, I got the bright idea to short the stock ahead of what has to be a poor report. Looks like the market got well ahead of me on THAT idea…
Daily T2108 vs the S&P 500
")
Black line: T2108 (measured on the right); Green line: S&P 500 (for comparative purposes)
Red line: T2108 Overbought (70%); Blue line: T2108 Oversold (20%)
Weekly T2108

*All charts created using freestockcharts.com unless otherwise stated
The charts above are the my LATEST updates independent of the date of this given T2108 post. For my latest T2108 post click here.
Related links:
The T2108 Resource Page
Expanded daily chart of T2108 versus the S&P 500
Expanded weekly chart of T2108
Be careful out there!
Full disclosure: net long the U.S. dollar; long AAPL call options and put spread; long call options on FSLR and SCTY
I feel that EUO has room to run.However if the Fed does not raise rates at
the next meeting I have doubts about my long in EUO.
I also think that SVXY is an opportunity heading into a Santa Claus rally,but may get slapped around a little by the Fed meeting.
Thanks again for for your opinions in the article.
Ray
Get an additional blog/change T2108’s title/stick to your knitting – Not sure which to recommend but I know I prefer the latter, at least for this blog with its present moniker. Got intrigued long ago by the seeming predictability of your 2108 metric in its original simple form. That morphed into something with what feels like a dozen or more additional rules. Now, with many words about inverse leveraged VIX puts, 8 or 10 individual stocks, ETFs,the dollar and so on, when I read your T2108 blog with only one paragraph of 10 or so addressing 2108, I long for the old knitting.
Best, Joe Conroy
I greatly prefer to fade volatility going into a Fed meeting. Outside that, I am looking for very quick trading opportunities. Thanks for reading!
Thanks for the feedback, Joe. I have long been thinking about changing the title of the blog to be more descriptive. I am not a great marketer. 🙁
It would be difficult to manage two different blogs, but I was hoping the tagging system would help people navigate to their focus of interest. I will also look into collecting together the T2108 material into a more succinct and organized way. Perhaps I can make this a project for the Christmas holidays. I have actually greatly simplified the T2108 rules, so I will write a new article making that part clearer. The rules are more complicated for overbought trading conditions, and THAT is definitely a work in progress.