
(T2108 measures the percentage of stocks trading above their respective 40-day moving averages [DMAs]. It helps to identify extremes in market sentiment that are likely to reverse. To learn more about it, see my T2108 Resource Page. You can follow real-time T2108 commentary on twitter using the #T2108 hashtag. T2108-related trades and other trades are occasionally posted on twitter using the #120trade hashtag. T2107 measures the percentage of stocks trading above their respective 200DMAs)
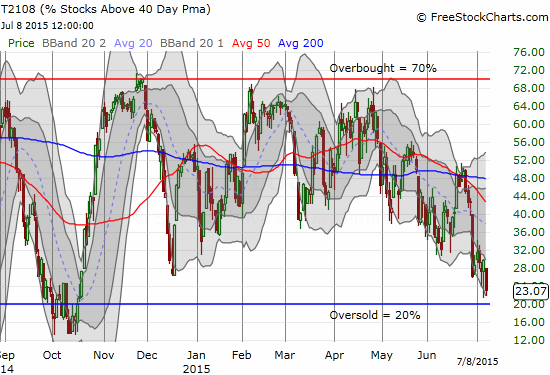
T2108 Status: 23.1%
T2107 Status: 35.9% (lowest close since Oct 20)
VIX Status: 19.7
General (Short-term) Trading Call: Bullish with strong caveats explained below
Active T2108 periods: Day #180 over 20%, Day #4 under 30% (underperiod), Day #7 under 40%, Day #33 under 50%, Day #50 under 60%, Day #249 under 70%
Reference Charts (click for view of last 6 months from Stockcharts.com):
S&P 500 or SPY
SDS (ProShares UltraShort S&P500)
U.S. Dollar Index (volatility index)
EEM (iShares MSCI Emerging Markets)
VIX (volatility index)
VXX (iPath S&P 500 VIX Short-Term Futures ETN)
EWG (iShares MSCI Germany Index Fund)
CAT (Caterpillar).
Commentary
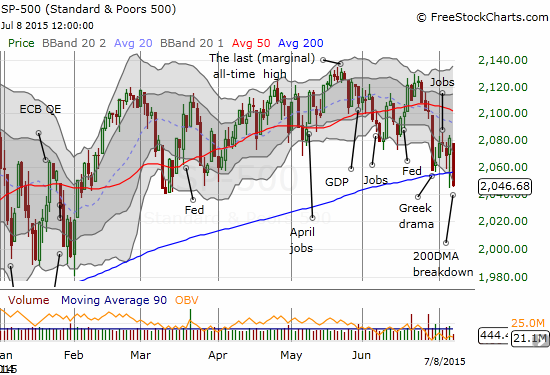
Tuesday’s trading (on July 7, 2015) featured a near-perfect combination of the S&P 500 (SPY) breaking 200DMA support as T2108 approached oversold conditions. T2108 dropped as low as 21.2% around 11:30am (Eastern). The S&P 500 first broke through 200DMA support around 10:10am and again around 10:30am. The index hit its low of the day around 11:40am. This is my favorite setup for a reversal as stops get taken out at support, washing out sellers, and oversold conditions (in this case “close enough”) trigger my buying rules. While I was optimistic, I was amazed that the the S&P 500 actually closed UP for the day. The move put my oil-related buys, purchase of CyberArk (CYBR), and Baidu (BIDU) call options well into the green. I was also relieved to have closed out my put options on Caterpillar (CAT) which served as my favorite market hedge.
Closed out $CAT puts. "Close enough" to oversold conditions in market to release hedge. #T2108 #120trade Still downside risk to at least $80
— Dr. Duru (@DrDuru) July 7, 2015
The close was so strong that I suppressed my urge to lock in profits on BIDU. Even the currency market was giving me some reassuring signals. If I were a true daytrader, I might have closed out everything.
As it turns out, the market angst is far from over. First, charts of the S&P 500 and T2108 show the dance around the 200DMA and oversold respectively.
Volatility is on the edge of making a fresh run-up and threatens to kill off my fade on volatility. Again, as a daytrader the current chop would have been just fine and very profitable. Both bears and bulls have had good opportunities to cash in. Yet, it seems the bears are on the edge of winning the battle soon.
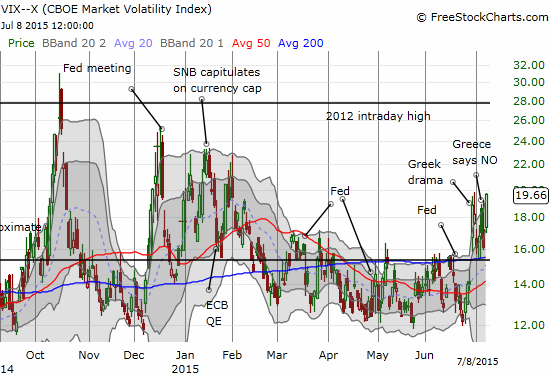
The VIX has closed at a new high for this recent churn. A close above the intraday high and THEN follow-through makes me a lot more bearish. On the other hand, T2108 should firmly plant itself in oversold territory at that point. My compromise on the dueling signals will be to execute the more conservative T2108 oversold strategies: wait to make the first buy when the VIX makes another large percentage move, preferably the largest of the current cycle. If no spike comes, then wait to make the first buy when T2108 first closes ABOVE oversold territory. It will be hard to execute such a strategy since my preference has always been to play oversold conditions aggressively.
The Australian dollar (FXA) versus the Japanese yen (FXY) presents another large concern. When AUD/JPY confirmed its breakdown on June 26th, the S&P 500 also confirmed a 50DMA breakdown. It has been all heck sine then. AUD/JPY has once again become a good indicator for the S&P 500.
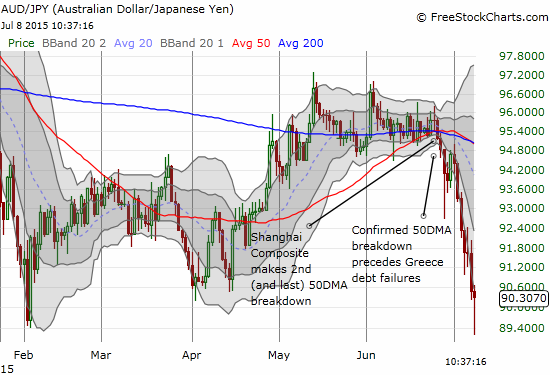
The most amazing thing about this chart is the speed and depth of the sell-off. The selling pressure is intense and nearly unrelenting as traders have been able to keep AUD/JPY below its lower-Bollinger Band (BB) for long stretches. AUD/JPY is immensely oversold based on the constant breaks of the lower-BB, but the trend is definitely down under these conditions.
Also note how the breakdown in AUD/JPY coincided in timing with the breakdown of the Shanghai Composite Index (SSEC). This is a new and surprising development and correlation that bears watching as the yen has clearly won the prize for “safety currency.” In the meantime, SSEC has reached another critical juncture – 200DMA support. Given the intensity of its sell-off, I cannot imagine any kind of support holding for long…especially when a barrage of desperate measures from the Chinese government to intervene and control its markets have utterly failed.
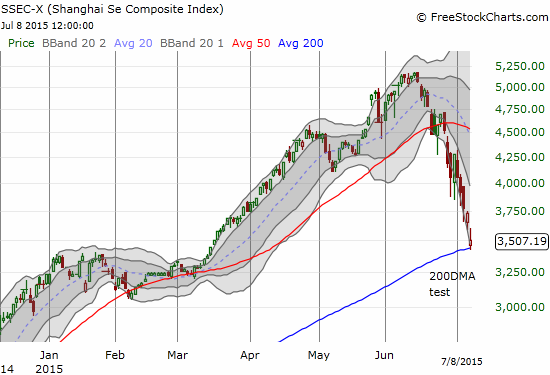
The latest story out of China is that the government has banned major shareholders from selling stocks for SIX MONTHS. This measure is about as draconian as it gets. It makes the market extremely illiquid and extremely unattractive whenever the market opens up for real business again. At least from my outsider’s perspective, China is now borderline dysfunctional. Even after our markets finally get a good oversold bounce, I will have little confidence in its sustainability given how the dysfunction from China will likely loom ever larger over financial markets.
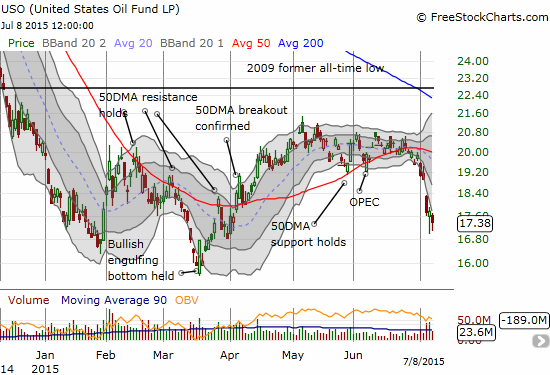
Finally, here is a chart of the United States Oil Fund LP (USO). I have finally become convinced that sellers are panicking out of oil because of a perceived implosion in demand from China. I am sticking to the strategy outlined in earlier posts. Oil volatility continues to rise and makes me more and more bearish on oil for the short-term (even as I am greedily eyeing very select oil companies to buy on the cheap amid this latest sell-off). I am going to ride out my current tranche of call options on USO.
There are many, many other charts and follow-ups that I could do. The market situation is very dynamic and fluid, so it is best that I not over-commit to reading a snapshot of charts on any given day. Moreover, the U.S. has now entered earnings season which layers on yet more potential for trouble and churn. I will continue to count on T2108 to assess the odds for the bear and bull cases.
Oh yeah. I did not even need to mention Greece once! The Global X FTSE Greece 20 ETF (GREK) STILL has not made a new low in this cycle. It may not even matter anymore in the larger scheme of things given the drama from China.
The German DAX stock mkt has dropped approx €200 billion in market cap in last few weeks. This is about 70% of the value of Greek govt debt
— Stephen Koukoulas (@TheKouk) July 8, 2015
Daily T2108 vs the S&P 500
")
Black line: T2108 (measured on the right); Green line: S&P 500 (for comparative purposes)
Red line: T2108 Overbought (70%); Blue line: T2108 Oversold (20%)
Weekly T2108

*All charts created using freestockcharts.com unless otherwise stated
The T2108 Resource Page
Expanded daily chart of T2108 versus the S&P 500
Expanded weekly chart of T2108
Be careful out there!
Full disclosure: net short the euro, long UVXY put options, long USO call options