
(T2108 measures the percentage of stocks trading above their respective 40-day moving averages [DMAs]. It helps to identify extremes in market sentiment that are likely to reverse. To learn more about it, see my T2108 Resource Page. You can follow real-time T2108 commentary on twitter using the #T2108 hashtag. T2108-related trades and other trades are occasionally posted on twitter using the #120trade hashtag. T2107 measures the percentage of stocks trading above their respective 200DMAs)
T2108 Status: 42.6%
T2107 Status: 46.9%
VIX Status: 14.0
General (Short-term) Trading Call: Neutral
Active T2108 periods: Day #172 over 20%, Day #131 above 30%, Day #7 over 40% (overperiod), Day #25 under 50% (underperiod), Day #42 under 60%, Day #241 under 70%
Reference Charts (click for view of last 6 months from Stockcharts.com):
S&P 500 or SPY
SDS (ProShares UltraShort S&P500)
U.S. Dollar Index (volatility index)
EEM (iShares MSCI Emerging Markets)
VIX (volatility index)
VXX (iPath S&P 500 VIX Short-Term Futures ETN)
EWG (iShares MSCI Germany Index Fund)
CAT (Caterpillar).
Commentary
In the last T2108 Update, I gave some examples of how “embracing the chop” has produced relatively consistent trading results. As the market chop extends further and further, the moving averages become more and more reliable friends. In particular, the 50-day moving average (DMA) has either flattened out or acquired a very steady ascent for several stock of key interest to me; they have provided convenient pivots for rangebound trading. Surprise, surprise, the S&P 500 (SPY) has spent the last two days reaching for its 50DMA yet again. The index is leading the way for 50DMA pivots.
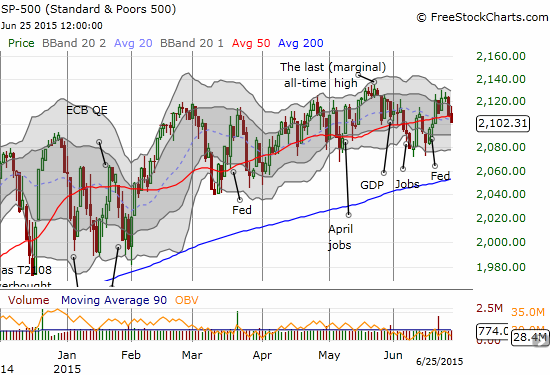
I did not try to play the top of the channel because T2108 was not extended enough. At its highest point, T2108 hit 51.4% on Monday. It never CLOSED above 50% all week. If T2108 gets back to the mid to low 30s, I will definitely reload on call options on ProShares Ultra S&P500 (SSO).
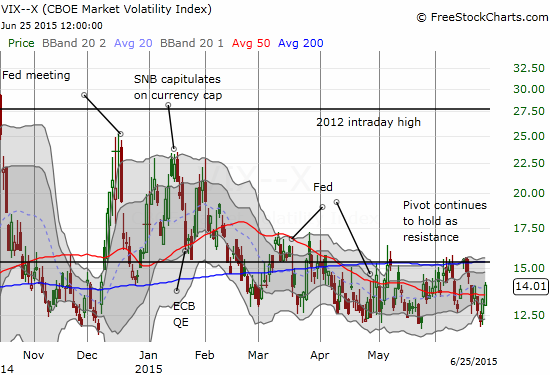
One reason for this slight bullish bias is the controlled behavior of the volatility index. It has yet to break above its 15.35 pivot since March. Sure the VIX is up 15% over the last two days, but I am unmoved until that pivot breaks and then holds as support.
Before I cover two cases of tradeable chop using the 50DMA, I give this chart of KB Home (KBH) as an important contrast. Last week, the market responded well to KBH earnings and the stock broke out above a downtrend line from KBH’s peak in 2013. This move is of course bullish for homebuilders and is even more important or KBH given it was trading at 2 1/2 year lows just 5 months ago.
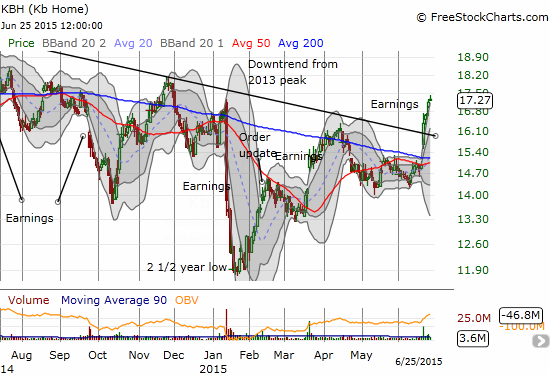
Of course, KBH still has a LOT to prove given the 2013 peak was at $25.14, a whole 46% away!
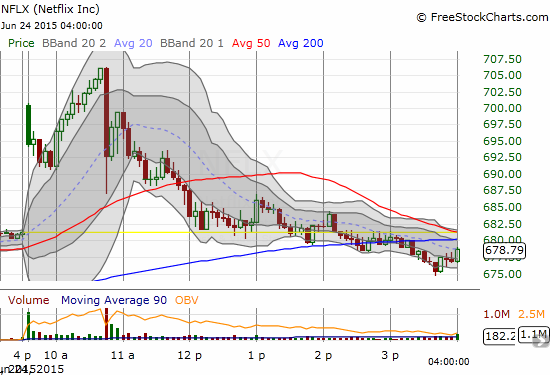
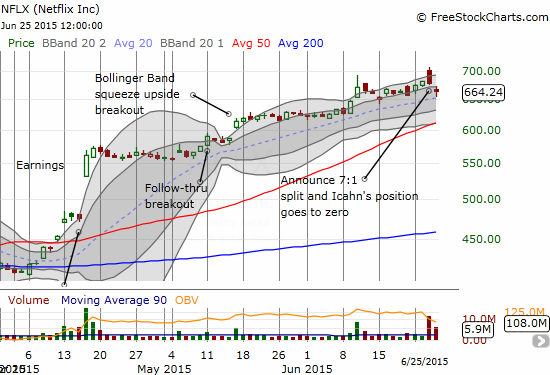
Next on the list is Netflix (NFLX). Buying dips continues to pay dividends. However, this week could be the last week for this trade.
Yesterday, June 24th, Carl Icahn made a splash by announcing that he had sold his remaining stake in NFLX. It is being called “the best trade ever” given the profits and massive return Icahn secured. I am even MORE impressed by Icahn’s ability to dump such a large stake and have such a non-remarkable impact on the stock. At the time Icahn made this revelation, NFLX was sitting at a fresh all-time high and had crossed the $700 threshold. At such a lofty level, Icahn’s exit of course brought out the sellers in droves. Icahn may have disturbed the entire (blissful) dynamic of NFLX.
Icahn was not pushing up the stock with buying, so his exit is not technically a withdrawal of buying volume. But *technically*, NFLX lost a major psychological force that helps traders and investors justify buying shares at this level and maintaining the momentum. So, I am ready to interpret a technical breakdown in NFLX as the end of the road or at least a signal to change strategy. I will not wait for a 50DMA breakdown for such a signal. Instead, I will be more conservative and draw a line in the sand below $623 where NFLX made its last big breakout.
The initial excitement on the day was caused by the official announcement of a 7:1 stock split. I am not sure why the acknowledgement of known plans caused such a stir. Anyway, I was kicking myself for not already having a position when I floated a Hail Mary with a limit order to buy a dip. In a case of better to be lucky than good, that dip came right after I got a price alert that NFLX had surged to a 3% gain on the day. Confused, I checked the account and, sure enough, I had purchased another tranche of call options that had already doubled in price! My initial instinct was to dump the shares and lock in my good fortune, but I decided to check the news first. I was even more confused that Icahn could cause a dip that did not last. After checking the intraday chart, I could see momentum from the bounceback was already starting to wane. That signal pushed the eject button for the position. Next, to press my luck further, I took some of my profits and placed another limit order. This one filled as well, but it will likely expire worthless tomorrow (Friday, June 26th).
NFLX dipped again today, and I bought after the stock was down over 3%. The stock eventually did bounce a little from those levels.
I tell these tales to demonstrate in real terms how I am executing on the NFLX strategy. The charts below show the action in pictures…
OK, NOW onto the 50DMA charts I promised earlier. Commentary provided below the charts.
Daily T2108 vs the S&P 500
")
Black line: T2108 (measured on the right); Green line: S&P 500 (for comparative purposes)
Red line: T2108 Overbought (70%); Blue line: T2108 Oversold (20%)
Weekly T2108

*All charts created using freestockcharts.com unless otherwise stated
The T2108 Resource Page
Expanded daily chart of T2108 versus the S&P 500
Expanded weekly chart of T2108
Be careful out there!
Full disclosure: long AAPL, USO, and NFLX call options