
(This is an excerpt from an article I originally published on Seeking Alpha on November 26, 2014. Click here to read the entire piece.)
As expected for this November, the S&P 500 (SPY) has continued a string of closes at fresh all-time highs. While the index is only about 2.8% above its all-time high preceding the steep September-October sell-off, I have noticed commentary that this rally has moved too far, too fast, including direct expressions of disbelief.
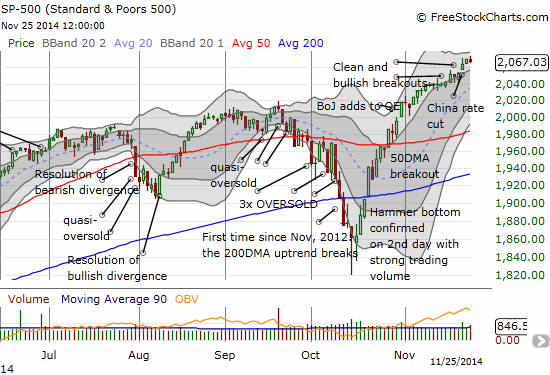
Source: FreeStockCharts.com
The disbelief is reminiscent of some of the sentiment that followed the last rally off a sell-off…just three months ago.
{snip}
Source for price data: Yahoo! Finance
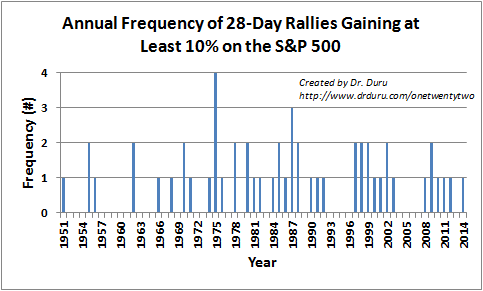
So in the recent memory of a lot of people, the current rally should indeed feel somewhat extreme. But such discomfort should be compared to the sell-off that preceded the rally. {snip}

Source for price data: Yahoo! Finance
Although these sell-offs are much less frequent than the current rally, recent years have seen a spate of such sell-offs. No surprise that 2008 delivered four of the 13 sell-offs since 2007. So, on balance, based on recent memory perhaps it makes sense that many might be more comfortable seeing sharp sell-offs than sharp rallies.
However, given over a longer timeframe the sell-off was indeed extreme and thus could (should?) have been seen for the buying opportunity that it represented as the market swung to oversold conditions (as defined by my favorite indicator, the percentage of stocks trading above their respective 40-day moving averages). {snip}
{snip}
Another objection could rest with the VIX, the volatility index, which is plunging all over again. {snip}
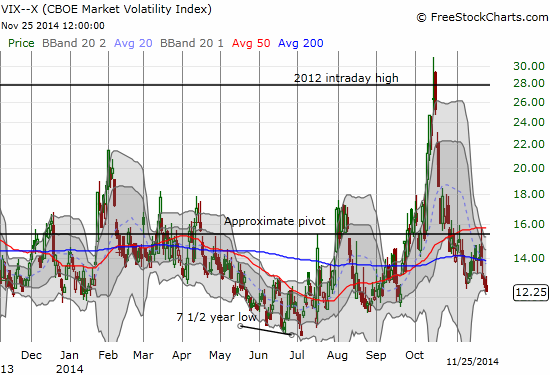
Source: FreeStockCharts.com
Finally, let’s compare the current rally to previous rallies relative to the VIX, the percentage of stocks trading above their 40DMAs (labeled T2108) and their 200DMAs (labeled T2107). Cells in yellow are more extreme than current levels for the respective indicator. (Collectively, data are only available since 1990).
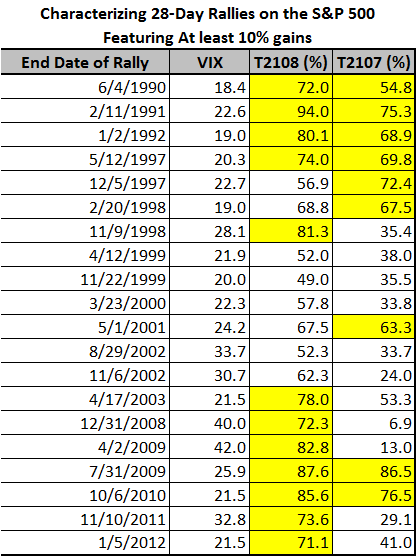
Source for data: Yahoo! Finance for VIX and S&P 500, FreeStockCharts.com for T2107 and T2108
{snip}
Be careful out there!
Full disclosure: long SSO
(This is an excerpt from an article I originally published on Seeking Alpha on November 26, 2014. Click here to read the entire piece.)