
(T2108 measures the percentage of stocks trading above their respective 40-day moving averages [DMAs]. It helps to identify extremes in market sentiment that are likely to reverse. To learn more about it, see my T2108 Resource Page. You can follow real-time T2108 commentary on twitter using the #T2108 hashtag. T2108-related trades and other trades are posted on twitter using the #120trade hashtag)
T2108 Status: 60.4%
VIX Status: 14.4
General (Short-term) Trading Call: Short (fade rallies with a focus on tech/momentum stocks)
Active T2108 periods: Day #184 over 20%, Day #33 over 50% (overperiod), Day #1 over 60% (underperiod), Day #8 under 70% (underperiod)
Reference Charts (click for view of last 6 months from Stockcharts.com):
S&P 500 or SPY
SDS (ProShares UltraShort S&P500)
U.S. Dollar Index (volatility index)
EEM (iShares MSCI Emerging Markets)
VIX (volatility index)
VXX (iPath S&P 500 VIX Short-Term Futures ETN)
EWG (iShares MSCI Germany Index Fund)
CAT (Caterpillar).
Commentary
T2108 rose to 60.4%. The VIX, the volatility index, sagged a fraction, the iShares MSCI Emerging Markets (EEM) gapped up and closed with a 0.79% gain, the Australian dollar broke out against the Japanese yen (AUD/JPY), and commodity stocks continued their recent bounce (for example copper rose 1.5% to a 2+ week high). All bullish developments. Even the S&P 500 (SPY) closed with a 0.46% gain even fading from its highs on the day. However, tech stocks and momentum stocks in general continued to be the market’s soft spot. The NASDAQ rallied just like the S&P 500 but it faded enough to end the day fractionally down. The 50-day moving average is starting to turn downward and served as effective resistance today.
The relative weakness of the NASDAQ has now reversed all of its out-performance for 2014. The following chart represents the ratio of the NASDAQ over the S&P 500.
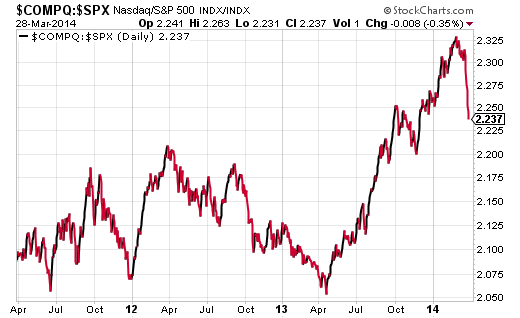
Source: StockCharts.com
Keeping to my trading rule, I am fading rallies, and I did so again today. The fade in QQQ was once again strong enough to make it worth my while to roundtrip my position. I closed out the puts with almost a 27% gain. At some point, I will have to try sticking to the position in order to have something in place in case the tech/momentum sell-off picks up steam.
For charts showing good short AND long setups, refer to the last T2108 Update (for March 27th). Little has changed from those assessments. Indeed, the bull/bear divergence I noted there has widened if anything.
Friday morning was another occasion to plant myself in front of CNBC blaring from the television. My excuse this time is that the wireless connection on my laptop is faltering, and it usually works best when I am in-sight of the wireless router/modem. The router happens to sit right next to the TV.
Anyway, as I watched the pundits and hosts talk warily about the current sell-off in momentum stocks and express increasing skepticism about the flood of IPOs this week and particularly on Friday, it occurred to me that I am missing an important element of sentiment by ignoring CNBC. Perhaps it is coincidence, but this is now the third time in two weeks that I have watched CNBC essentially set the tone for early morning trading. Perhaps they are just well in-tune with the fundamental sentiment. Either way, the broadcast in those first minutes/hours has proven useful.
The most intriguing development for me is the apparent growing skepticism regarding the rush of companies clamoring for the feeding trough of investor money in the IPO market. I say this because I have noticed my own stock broker flood me with a bunch of IPO announcements in recent weeks. I interpret this sudden willingness to keep asking for retail (my) money – where were they when I wanted shares of Workday (WDAY)?!? – as a sign that demand is drying up and companies are finding it necessary to reach for every penny. I am guessing that this window of difficulty is leaving or will leave a good number of otherwise good/promising companies with discounted stock prices. I am in the process of building my shopping list and hope to be ready when golden opportunities arise (like an oversold stock market). Stay tuned!
Daily T2108 vs the S&P 500
")
Black line: T2108 (measured on the right); Green line: S&P 500 (for comparative purposes)
Red line: T2108 Overbought (70%); Blue line: T2108 Oversold (20%)
Weekly T2108

*All charts created using freestockcharts.com unless otherwise stated
Related links:
The T2108 Resource Page
Expanded daily chart of T2108 versus the S&P 500
Expanded weekly chart of T2108
Be careful out there!
Full disclosure: long SSO puts, net short Australian dollar, long EEM puts
I wish to compliment you on your methodology and quantifying when to enter positions especially what appears currently to be a market top with a back and fill bias. What I hate is the constant opening with futures up in the pre opening of always 30 points.
Not boasting, but I have studied the markets over many years (since is was 11) and have developed a sense of the market mostly having studied Dow theory, waves, etc, notwithstanding Black outliers.
Mostly today, I am in high dividend payers via ETFs
through LVL, SDIV, DWX as well as individual stocks. I know, I know a crowded trade. Hedged via TVIX.
I was recently looking for a way to hedge DWX and dividend payers. What I found was that EUM(short emerging markets) was a fair hedge.
I noticed that you are long eem puts. Should I infer by you position to mean you likewise do not believe in the current bull market in eem.
Inquiring minds seek knowledge.
I am very skeptical of the rise in EEM right now, and I am hard-pressed to explain it. I do see EWZ making a strong bounce and commodities recovering from recent lows. So perhaps this is related to dead-cat bounces. Regardless, yes, I agree it is a good hedge against longs.
I also have a strategy to play EEM breaks to the upside or downside by buying straddles or strangles. I have had mixed success, and it just so happens that I decided to stick to the bearish side since I think the market has topped out by now. The breakout above the 200DMA has me second-guessing! More follow-through to the upside from here, and I will start wondering when tech stocks will start roaring back…!
Thanks for taking the time to ping me with the comment!