
(This is an excerpt from an article I originally published on Seeking Alpha on August 7, 2013. Click here to read the entire piece.)
Tuesday’s trading (August 6, 2013) brought out the taper tantrum jitters again. Officials from the Federal Reserve are once again reminding financial markets about the potential for September to bring the beginning of the end of QE3’s bond-buying program. {snip}
The end result is that the market is now slowly but surely reversing the nice breakout that began the month.
On the other side of these Fed officials sit pundits who insist that Friday’s jobs report was a disappointment. {snip}
The ability to interpret the data as both bullish and bearish has created some odd, even confused(?) patterns in financial markets. {snip}
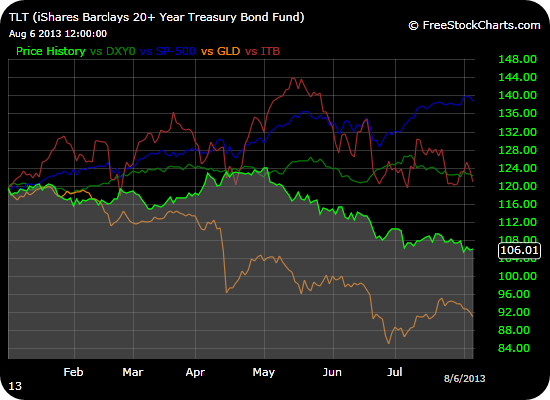
The chart below shows the iShares Barclays 20+ Year Treasury Bond ETF (TLT) on a steady downtrend since early May (higher interest rates) (bright green line). Surrounding TLT is an odd mixture of reactions and even anticipations.
{snip}
It was tempting for me to conclude that perhaps the missing element is inflation expectations. If inflation expectations are increasing along with rates, then real rates are not changing. However, stationary real rates cannot consistently explain this mix of movements in the financial market. Moreover, the estimates for inflation expectations from the Cleveland Federal Reserve continue to show a steady decline even as nominal rates have risen.
I am left with the conclusion that the bond market is essentially following a mind of its own while only some elements of the market choose to care. {snip}
Source for charts: FreeStockCharts.com
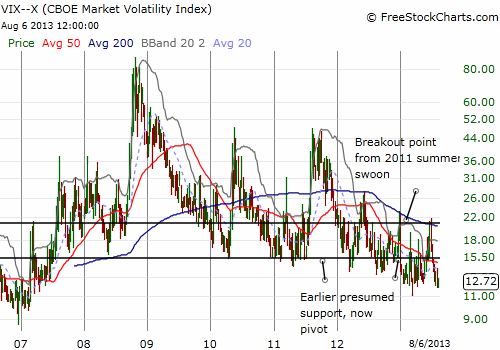
I like to track the percentage of stocks trading above their 40-day moving averages. This indicator has limped lower for two weeks after stopping “inches” short of hitting the overbought level (70%). {snip} Currency markets will likely amplify the churn.
Be careful out there!
(This is an excerpt from an article I originally published on Seeking Alpha on August 7, 2013. Click here to read the entire piece.)
Full disclosure: long GLD, TBT, net long U.S. dollar