
(T2108 measures the percentage of stocks trading above their respective 40-day moving averages [DMAs]. It helps to identify extremes in market sentiment that are highly likely to reverse. To learn more about it, see my T2108 Resource Page. You can follow real-time T2108 commentary on twitter using the #T2108 hashtag. T2108-related trades and other trades are posted on twitter using the #120trade hashtag)
T2108 Status: 44.2% (ends 3 straight days of quasi-oversold conditions)
VIX Status: 15.1 (surprise, surprise, below support again!)
General (Short-term) Trading Call: Close out longs and otherwise hold. See below.
Active T2108 periods: Day #1 over 40% (overperiod); Day #6 under 50% (underperiod), Day #12 under 70% (underperiod)
Reference Charts (click for view of last 6 months from Stockcharts.com):
S&P 500 or SPY
SDS (ProShares UltraShort S&P500)
U.S. Dollar Index (volatility index)
VIX (volatility index)
VXX (iPath S&P 500 VIX Short-Term Futures ETN)
EWG (iShares MSCI Germany Index Fund)
CAT (Caterpillar)
Commentary
Any bears who tried to chase the market lower this week are holding tight this weekend bracing for a potential breakout. After the S&P 500 rammed right up against the bear/bull dividing line yesterday, it gapped up and closed the day right up against the current short-term downtrend line…which also happens to coincide with a flattening 20DMA.

As promised in the last T2108 Update, I sold my remaining 60% of SSO calls into the market’s strength. This trade completed one of the most successful T2108 trades to-date. I did not maximize the profits on the day (I left another 30% or so on the table) but for a few minutes I was relieved to have sold after the S&P 500 spent the first 15 minutes or so after the open trying to fade. The inability of sellers to push that fade is one more indicator that the bulls may actually have enough juice next week to push the market higher.
Under my trading bearish plan, I was supposed to load up on SSO puts at a test of the downtrend. I did not execute because of the market’s amazing momentum on the day. Just like Thursday, I tend to assume that a close right on resistance is a signal that resistance will soon fall. Strong resistance would not facilitate buyers hanging around. Sellers should have stepped in to cause some kind of fade. I am on the look-out for a gap up on Monday. Note that Mondays are on average down on the S&P 500 this year even when Friday is up. Since 1950, Mondays are on average down EXCEPT when Friday trades up.
The VIX underlined the “strike back” by the bulls. The volatility index got crushed by 9.0% and closed BELOW the important support/resistance line that I monitor around 15.2. This is the fourth episode this year with the VIX tumbling below its support/resistance line. On each occasion it preceded the next phase in the S&P 500’s rally.
Finally, in trades I featured in the previous post, I was stopped out of my CAT puts. In retrospect, I should have closed them when CAT was trading well below its lower Bollinger Band, but I did indeed get greedy. I cannot complain though as I had a good ride down. I flipped AAPL calls today. Trading according to the Apple pattern of strong starts to the week and weak ends, I bought calls on Apple’s dip into support at the 50DMA and previous low from 2012. I decided to sell into the surge given the 20DMA is now guiding the stock lower. AAPL perfectly retested that resistance and slightly pulled back.
Finally, finally, I bought Google (GOOG) calls at the same time I bought AAPL calls. I grit my teeth and decided to hold them through the weekend. The setup for GOOG was irresistible, and I am kicking myself for not having the awareness to buy on Thursday’s bounce off the lower-Bollinger Band. IF GOOG can push past a flattening 20DMA next week, the stock could really take off. I suspect this is exactly what will happen if the S&P 500 manages to break out next week. GOOG has already broken free of the grip of its short-term downtrend.
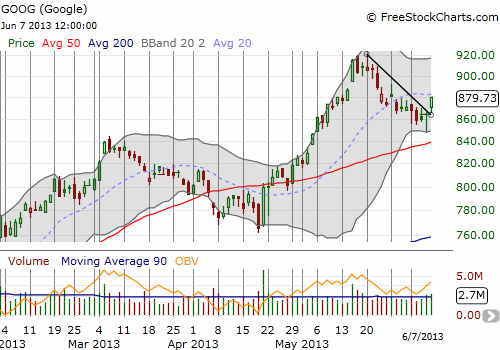
Per a reader’s suggestion, I am finally going to get back to analyzing trades in GOOG. The most intriguing prospect to me is in connecting and correlating GOOG patterns with those of the S&P 500 so that I can directly leverage the T2108 Trading Model (TTM). Stay tuned!
Daily T2108 vs the S&P 500
")
Black line: T2108 (measured on the right); Green line: S&P 500 (for comparative purposes)
Red line: T2108 Overbought (70%); Blue line: T2108 Oversold (20%)
Weekly T2108

*All charts created using freestockcharts.com unless otherwise stated
Related links:
The T2108 Resource Page
Expanded daily chart of T2108 versus the S&P 500
Expanded weekly chart of T2108
Be careful out there!
Full disclosure: long CAT shares, long GOOG calls