(T2108 measures the percentage of stocks trading above their respective 40-day moving averages [DMAs]. It helps to identify extremes in market sentiment that are highly likely to reverse. To learn more about it, see my T2108 Resource Page. You can follow real-time T2108 commentary on twitter using the #T2108 hashtag. T2108-related trades and other trades are posted on twitter using the #120trade hashtag)
T2108 Status: 57.8%
VIX Status: 14.7
General (Short-term) Trading Call: Hold
Reference Charts (click for view of last 6 months from Stockcharts.com):
S&P 500 or SPY
SDS (ProShares UltraShort S&P500)
U.S. Dollar Index (volatility index)
VIX (volatility index)
VXX (iPath S&P 500 VIX Short-Term Futures ETN)
EWG (iShares MSCI Germany Index Fund)
CAT (Caterpillar)
Commentary
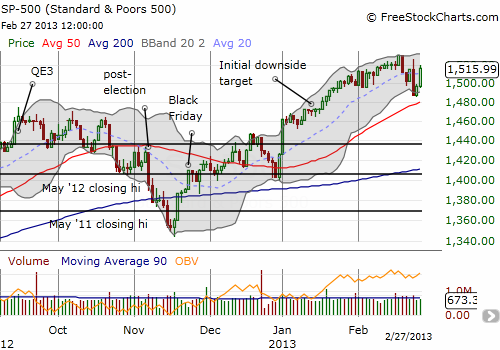
The S&P 500 has come roaring back from the bearish flashpoint on Monday. The index has reversed all those losses and closed the day with a 1.3% gain.

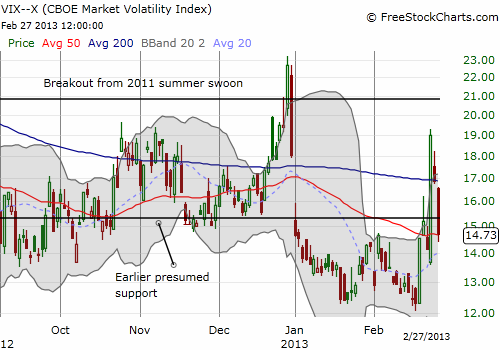
T2108 did not increase as much as I would have expected on such a rally, and it fell three percentage points short of recovering all of its losses from Monday (a few stocks are getting left behind in this bounce!). Given I am still targeting an imminent retest of the 50DMA for the S&P 500, I went ahead and reloaded on SSO puts. This trade is not technically a T2108 trade given the indicator has not yet flipped to overbought. The trade is also particularly aggressive given a new month starts in just two days: the start of months tend to produce large upside performances. Moreover, the VIX is in full retreat again. After pulverizing three levels of resistance on Monday, the VIX is now already resting on the first level of (former) resistance (the 50DMA). The VIX is once again below the critical 15.32 level and is in danger of more meandering toward its multi-year lows.

My losses on VXX shares exceeded the gains on VXX puts and proved that I did not buy enough puts on the VIX spike. Clearly, I still have some fine-tuning to do on that VXX trading strategy!
This bounce also had me wondering even more whether I need to take the concept of “quasi-oversold” even more seriously. On Monday, T2108 dropped 20% in one day, almost as much as the two-day drop that proceeded the one-day bounce in the S&P 500 that I accurately foretasted last week. This time around, I waved off the possibility even though the VIX spiked in historical proportions (#11 all-time!). I simply lacked the trifecta of strong signals that I had last week, but maybe, just maybe, the large spike in the VIX was enough.
My preliminary analysis has not yet uncovered a smoking gun for quasi-oversold. First, there is absolutely no correlation between the daily change in T2108 and the subsequent daily change in the S&P 500. This holds true even when I filter to days where T2108 declines or even to just those days when T2108 declines by 10% or more or even when T2108 declines on two consecutive days. I also found no correlation when looking at occurrences where T2108 declined for two days and ended up between overbought and oversold extremes. Again, no correlation when I further filtered to 2-day declines of 15% or more. In all these cases, I also looked at the percentage of up versus down days. Based on history, there was a 56% chance last week of the S&P 500 trading up after last week’s steep 2-day decline in T2108. That is enough for a trading edge over a long period of time, but I am looking for a much stronger performance to justify creating a whole new trading strategy for T2108.
This all left me scratching my head, wondering what to make of all this. Was last week’s call pure luck or did the extra context provide true determining factors? I think it was context. And I think this week I overly discounted the context of an extreme in the VIX. My next step for the quasi-oversold analysis is to combine daily changes in the VIX to see whether that adds more color. Stay tuned!
(For the techies out there, note that I tried a classification algorithm on the dataset {rpart in R}. This too provided no insight. I am taking a class in data mining and hope to use such techniques to further refine the study and trading on T2108).
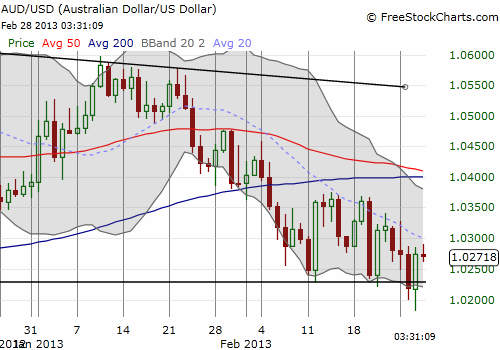
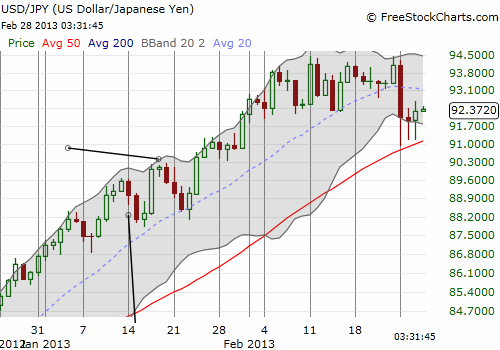
Finally, the currency markets have bounced away from the edge of a major bearish swoon. Most notably, the Australian dollar bounced back strongly on Wednesday after cracking the 1.02 mark. The Aussie is still holding tight to the 2010/2011 closing levels. The yen has also refused to follow-through on Sunday/Monday’s strengthening. In fact, all the yen pairs are now printing what look like sustainable bottoms. Most notably, USD/JPY held its 50DMA. I am watching the currency markets even more closely than usual for early clues on the market’s short-term sentiment.


Daily T2108 vs the S&P 500

Black line: T2108 (measured on the right); Green line: S&P 500 (for comparative purposes)
Red line: T2108 Overbought (70%); Blue line: T2108 Oversold (20%)
Weekly T2108

*All charts created using freestockcharts.com unless otherwise stated
Related links:
The T2108 Resource Page
Expanded daily chart of T2108 versus the S&P 500
Expanded weekly chart of T2108
Be careful out there!
Full disclosure: long VXX shares and puts, long SSO puts, long USD/JPY, short AUD/USD

Good news! I respecified the model and now have some very interesting trading results and trading rules. I need to rerun this with cross-validation to make sure I have something significant, but the MOST intriguing finding is that the T2108 rules are completely independent of the VIX!
Not a surprise to me your T2108 curve is independent from the VIX…VIX is how traders are feeling at that point in time. If I understand you T2108 rule / chart..all that shows is over or under bought.
This market is like no other market you or I have seen..what we always have needed is a “crystal ball” telling us when people will decide to relax and take their money out of a relatively more safe place and put it in the market… “that is a political question.” We all know there are bundles of cash on the side lines the question is when will everyone relax and get this economy moving again.
I respect your attempt to quantify what’s happening in this market. The reason I say “this market is like no other you or I have seen” is because of the money Uncle Sam is pouring into everything in sight. Proof of that is simple..look at Friday’s climb of the S&P500..very low volume..incredibly low volume over all..but what did we see an up line that would take your breath away!
Think of this market like you’re playing Monopoly with three other player’s. But one other player has stacks of money from a couple other game boxes..and no-one knows it but him! That fellow is Uncle Sam. Actually World economic analogies can be extrapolated even father. The World is a play ground like the one I remember when I was in 5th grade.
We played marbles, and some of us were better than others, but there seem to always be one fellow who had the most marbles even if he couldn’t shoot worth a darn. One day I found out how he did that..I was walking around the building and there he was, he beat me to a pulp, and took my bag full of marbles.:((
Well the world works the very same way except for one difference. The world likes “Green Backs” the dollar above all else..in fact I believe the fellow with the biggest, meanest, deadliest gun WINS. He wins the right to print the money, and really if you look at it closely you’ll see no-one really trusts any other currency more than the US dollar. Further it’s my belief, that if any other currency became a “really” strong competitor to the dollar (World wide) we would one way or the other use our superior killing power to stop that threat. In fact I believe the fellow (Country) with the biggest Gun..and is willing to use it WINS…all the marbles, and the right to make all the marbles he wants!
Correct – T2108 is all about identifying overbought and oversold rules. I am going to publish a major update in the coming week or two based on some analyses I have done using machine learning techniques and a more comprehensive review of all thresholds.
I forgot to mention that I fully agree this is a market like none other. The printing press is powerful and still under-appreciated. Including by me!