(T2108 measures the percentage of stocks trading above their respective 40-day moving averages [DMAs]. It helps to identify extremes in market sentiment that are highly likely to reverse. To learn more about it, see my T2108 Resource Page. You can follow real-time T2108 commentary on twitter using the #T2108 hashtag. T2108-related trades and other trades are posted on twitter using the #120trade hashtag)
T2108 Status: 57.1%
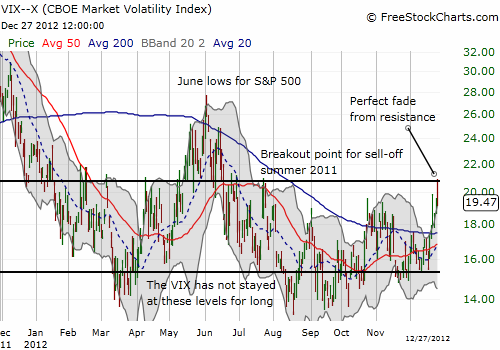
VIX Status: 19.5 (21 at the high)
General (Short-term) Trading Call: Hold (OK to buy S&P 500 as a bounce from 50DMA)
Reference Charts (click for view of last 6 months from Stockcharts.com):
S&P 500 or SPY
SDS (ProShares UltraShort S&P500)
U.S. Dollar Index (volatility index)
VIX (volatility index)
VXX (iPath S&P 500 VIX Short-Term Futures ETN)
EWG (iShares MSCI Germany Index Fund)
CAT (Caterpillar)
Commentary
It has been 9 calendar days and 6 trading days since the last T2108 update. At the time, the S&P 500 had completed a strong two-day bounce off the 50DMA delivering a 2.2% gain over those two days. T2108 closed at 67.1%; with overbought conditions within reach, I was wrestling with the prospect of dealing with a “sell” signal. Since then, the S&P 500 has dropped 5 out of 6 trading days – a reminder that sometimes “close enough” is “good enough.” Today, the S&P 500 cut right through 50DMA support like butter and finally stopped at the highs from Black Friday. With Fiscal Cliff headlines churning the market, the S&P 500 suddenly launched into a near perfect recovery right at 2:30pm (a common time for inter-day reversals). The end result was a near flat day.

Earlier in the day, I tweeted the following: “#VIX approaching what has been stiff resistance at 21. Volatility products like $VXX have had a great run the past week.” Sure enough, VIX rallied right 21, and, you guessed it, the rally on the S&P 500 caused the VIX pull back perfectly from resistance. Yes, you cannot make this stuff up. (As a reminder, 21 was the level of the VIX when the S&P 500 first broke down during the summer of 2011).

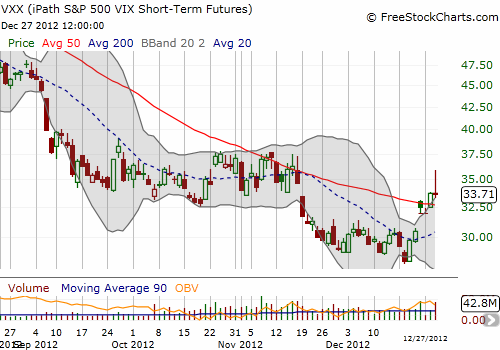
The iPath S&P 500 VIX ST Futures ETN (VXX) faded as well. It was primed to fade given it was trading well above the upper Bollinger Band (BB). It was a great run though: at one point, 28% above the all-time lows. Before this run, VXX could barely strong together two winning days in a row, much less a rally. While VXX has broken above its 50DMA, I am already assuming it is a false breakout. all paths lead downward for VXX, and it is just a matter of time. I do not consider it an indicator or predictor of the outcome of Fiscal Cliff negotiations.

So where does all this put us?
As much as I hate to pay attention to the machinations in DC, it is now all about Fiscal Cliff headlines. We are in official countdown mode now, and the market will wiggle and jiggle at the slightest Fiscal Cliff breath. Technicals are not going to help predict the outcome for us, but they should guide us in our response to the market’s response. If things go badly, I expect T2108 to drop to oversold conditions rather quickly and almost as quickly experience a relief rally. I am guessing a lot of people are on the sidelines of this market waiting to put money to work; a good number of them are ITCHING to get in and will pull triggers early. I still want to buy into such a sell-off.
If instead the market rallies in response to the resolution of the Fiscal Cliff, I expect T2108 to jump to overbought conditions within days. Perhaps there might be a small speedbump at natural resistance from the triple top and/or December’s high. While it will be tempting to jump the gun on fading such a rally, I am more inclined to wait and see…yes, even after missing an opportunity to fade the last rally! As a reminder, markets can stay overbought a lot longer than they can stay oversold. In this case, a lot of people on the sidelines of the market may rush in afraid that the train will soon leave them at the station for good…at least until we figure out something newto worry about (a fresh euro crisis anyone?).
Daily T2108 vs the S&P 500

Black line: T2108 (measured on the right); Green line: S&P 500 (for comparative purposes)
Weekly T2108

*All charts created using freestockcharts.com unless otherwise stated
Related links:
The T2108 Resource Page
Expanded daily chart of T2108 versus the S&P 500
Expanded weekly chart of T2108
Be careful out there!
Full disclosure: long VXX shares and puts; long SSO calls
