(T2108 measures the percentage of stocks trading above their respective 40-day moving averages [DMAs]. It helps to identify extremes in market sentiment that are highly likely to reverse. To learn more about it, see my T2108 Resource Page. You can follow real-time T2108 commentary on twitter using the #T2108 hashtag. T2108-related trades and other trades are posted on twitter using the #120trade hashtag)
T2108 Status: 20.0% (oversold day #3)
VIX Status: 16.4
General (Short-term) Trading Call: Keep closing out shorts; if aggressive, start buying; if conservative, try to wait for higher VIX, a large spike into mid-20s would be ideal (but note that if VIX does not spike, conservative traders will likely miss the best entry points)
Reference Charts (click for view of last 6 months from Stockcharts.com):
S&P 500 or SPY
SDS (ProShares UltraShort S&P500)
U.S. Dollar Index (volatility index)
VIX (volatility index)
VXX (iPath S&P 500 VIX Short-Term Futures ETN)
EWG (iShares MSCI Germany Index Fund)
CAT (Caterpillar)
Commentary
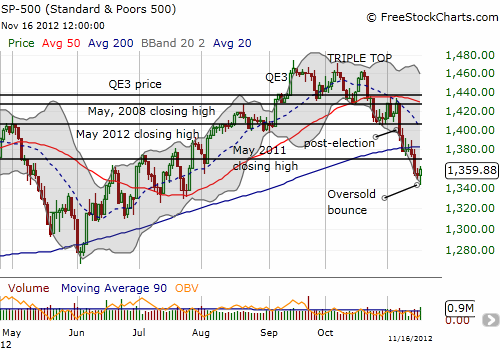
The S&P 500 finally experienced an oversold bounce. After dropping as low as 1343, the index bounced to close 0.5% higher on the day. This bounce still leaves the index in negative territory relative to the pre-election trade.

Source: FreeStockCharts.com
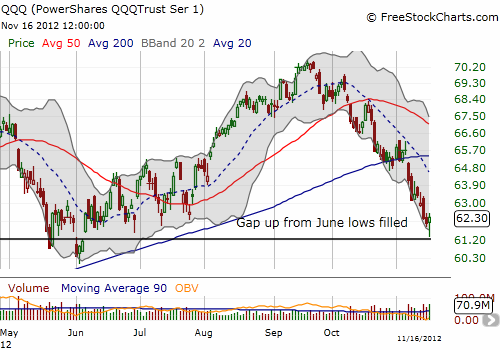
On Friday, I suspected that at the S&P 500’s lows of the day, T2108 approached 10%. That assessment motivated my tweet earlier in the day that shorts should avoid chasing anything lower. Right after that tweet, I realized that for the T2108 strategy, such an assessment suggested I needed to buy. I decided to load up on more SSO shares and calls and even threw in some PowerShares QQQ Trust, Series 1 (QQQ). QQQ is particularly attractive because at the lows of the day, the technology ETF filled the gap up that left the June lows behind.

If there was any doubt that the market is reluctant to send volatility higher, then Friday should erase what doubts linger. Despite a marginal gain for the S&P 500, the volatility index, the VIX, cratered 8.7% to close at 16.4. I complained earlier that the fear index should be much higher given the selling and the supposed reasons for it. Given volatility’s performance last week, we should not expect a volatility spike without some extremely strong and extremely surprising NEW negative catalyst to enter the scene. This implies that conservative investors waiting for a VIX spike before buying are likely going to get left waiting.
T2108 remains oversold, albeit marginally, for a third day. It is very possible that T2108 drifts in and out of oversold territory for the next few weeks as headline risks sway the market from emotional lows to highs and back again. Under such conditions, I will be quick to take profits on SSO calls, but I intend to continue holding my SSO shares until the drama over the Fiscal Cliff gets resolved one way or the other (for the record, I am VERY optimistic that things will get resolved in a satisfactory manner – but I will save such speculation for a different post!). Going forward, normal T2108 rules will continue to apply for adding to bullish SSO positions.
Here is Art Cashin discussing how to trade Fiscal Cliff yo-yo with Bob Pisani on CNBC. Cashin calls this action the “White House Lottery Ticket”:
To Cashin’s point, buying protection makes sense here given volatility is so incredibly low. In the coming days, I hope to come up with a specialized trade set-up for this like buying long-dated calls and call spreads backstopped with short-term puts. Stay tuned.
Daily T2108 vs the S&P 500

Black line: T2108 (measured on the right); Green line: S&P 500 (for comparative purposes)
Weekly T2108

*All charts created using freestockcharts.com unless otherwise stated
Related links:
The T2108 Resource Page
Expanded daily chart of T2108 versus the S&P 500
Expanded weekly chart of T2108
Be careful out there!
Full disclosure: long SSO calls and shares, long VXX shares, long QQQ
