The stock market has churned and gone nowhere for 10 trading days, a distinct break in the steady drip upward that saw traders, investors, and even trading-bots seizing upon nearly every dip as a buying opportunity. For six months a very basic equation has dominated: printing money = higher stock prices. For now, a conditional has inserted itself into this equation: if oil prices rise higher past $100/barrel, then think at least twice. It is too soon to guess when market participants might begin to anticipate a QE3 that prints enough money to pay the higher gasoline bills, but I will not be surprised if we find out the Federal Reserve is considering such an option (in effect, not directly, of course) given its extreme fear of a stalled recovery.
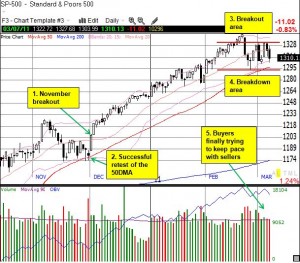
The stock market’s current wobble is similar to the wavering in November. Bear versus bull battle lines are being drawn that, just like in November, clearly separate another breakout from a rare breakdown.
(Click for a larger view)

The breakout in November was quite clean. The S&P 500 tested the 50DMA, even broke below it, but never closed below that important support line – after two consecutive days of testing, the index was off to the races. I will be very surprised if such a clean breakout or breakdown occurs this time just since the main catalyst is itself so volatile. However, I will be applying the exact same criteria to determine the next definitive move.
The most intriguing difference between November and the current test of support is T2108, the percentage of stocks trading above their 40DMAs. In November, T2108 seemed headed for oversold conditions while getting as low as 40% or so. Now, T2108 has bounced in and out of overbought territory (70% or higher) with each trip into overbought territory leading into the next sell-off (I chronicled most of this action on my T2108 resource page). Now, T2108 = 61% and is coming off a two-day stint in overbought territory.
I had earlier claimed that the next trip into overbought territory would be the last for the S&P 500 for a while. However, the market just exited its second stay in overbought territory since I made those claims. Apparently, the determination to buy stocks remains strong even with oil on the rise. Bears should duly note this behavior: if the oil squeeze gets lifted anytime soon for some reason, the stock market could lift very swiftly. This probably explains why puts and volatility still seem so “cheap” to me.
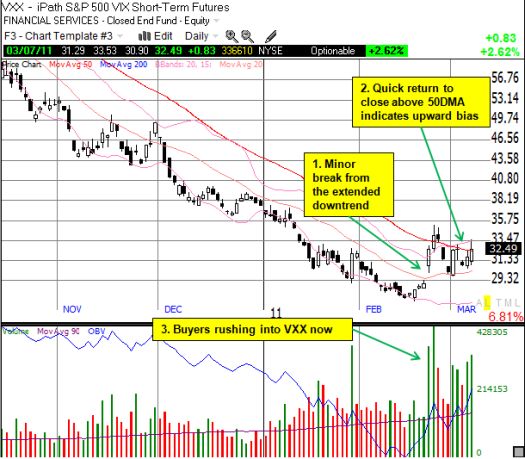
I close with this graph of the long-suffering VXX, the iPath S&P 500 VIX Short-Term Futures. It looks like a potential bottoming process (short-term of course) is underway:

*All charts created using TeleChart:

Be careful out there!
Full disclosure: long SSO puts, long VXX
